French Canadian vs Immigrants from Iran Married-Couple Family Poverty

COMPARE

French Canadian
Race
Ancestry
AfghanAfricanAlaska NativeAlaskan AthabascanAlbanianAleutAlsatianAmericanApacheArabArapahoArgentineanArmenianAssyrian/Chaldean/SyriacAustralianAustrianBahamianBangladeshiBarbadianBasqueBelgianBelizeanBermudanBhutaneseBlackfeetBolivianBrazilianBritishBritish West IndianBulgarianBurmeseCajunCambodianCanadianCape VerdeanCarpatho RusynCelticCentral AmericanCentral American IndianCherokeeCheyenneChickasawChileanChineseChippewaChoctawColombianColvilleComancheCosta RicanCreeCreekCroatianCrowCubanCypriotCzechCzechoslovakianDanishDelawareDominicanDutchDutch West IndianEastern EuropeanEcuadorianEgyptianEnglishEstonianEthiopianEuropeanFijianFilipinoFinnishFrenchFrench American IndianFrench CanadianGermanGerman RussianGhanaianGreekGuamanian/ChamorroGuatemalanGuyaneseHaitianHmongHonduranHopiHoumaHungarianIcelanderIndian (Asian)IndonesianInupiatIranianIraqiIrishIroquoisIsraeliItalianJamaicanJapaneseJordanianKenyanKiowaKoreanLaotianLatvianLebaneseLiberianLithuanianLumbeeLuxembourgerMacedonianMalaysianMalteseMarshalleseMenomineeMexicanMexican American IndianMongolianMoroccanNative HawaiianNavajoNepaleseNew ZealanderNicaraguanNigerianNorthern EuropeanNorwegianOkinawanOsageOttawaPaiutePakistaniPalestinianPanamanianParaguayanPennsylvania GermanPeruvianPimaPolishPortuguesePotawatomiPuebloPuerto RicanPuget Sound SalishRomanianRussianSalvadoranSamoanScandinavianScotch-IrishScottishSeminoleSenegaleseSerbianShoshoneSierra LeoneanSiouxSlavicSlovakSloveneSomaliSouth AfricanSouth AmericanSouth American IndianSoviet UnionSpaniardSpanishSpanish AmericanSpanish American IndianSri LankanSubsaharan AfricanSudaneseSwedishSwissSyrianTaiwaneseThaiTlingit-HaidaTohono O'OdhamTonganTrinidadian and TobagonianTsimshianTurkishU.S. Virgin IslanderUgandanUkrainianUruguayanUteVenezuelanVietnameseWelshWest IndianYakamaYaquiYugoslavianYumanYup'ikZimbabwean
Immigration
NonimmigrantsImmigrantsAfghanistanAfricaAlbaniaArgentinaArmeniaAsiaAustraliaAustriaBahamasBangladeshBarbadosBelarusBelgiumBelizeBoliviaBosnia and HerzegovinaBrazilBulgariaBurma/MyanmarCabo VerdeCambodiaCameroonCanadaCaribbeanCentral AmericaChileChinaColombiaCongoCosta RicaCroatiaCubaCzechoslovakiaDenmarkDominicaDominican RepublicEastern AfricaEastern AsiaEastern EuropeEcuadorEgyptEl SalvadorEnglandEritreaEthiopiaEuropeFijiFranceGermanyGhanaGreeceGrenadaGuatemalaGuyanaHaitiHondurasHong KongHungaryIndiaIndonesiaIraqIrelandIsraelItalyJamaicaJapanJordanKazakhstanKenyaKoreaKuwaitLaosLatin AmericaLatviaLebanonLiberiaLithuaniaMalaysiaMexicoMicronesiaMiddle AfricaMoldovaMoroccoNepalNetherlandsNicaraguaNigeriaNorth AmericaNorth MacedoniaNorthern AfricaNorthern EuropeNorwayOceaniaPakistanPanamaPeruPhilippinesPolandPortugalRomaniaRussiaSaudi ArabiaScotlandSenegalSerbiaSierra LeoneSingaporeSomaliaSouth AfricaSouth AmericaSouth Central AsiaSouth Eastern AsiaSouthern EuropeSpainSri LankaSt. Vincent and the GrenadinesSudanSwedenSwitzerlandSyriaTaiwanThailandTrinidad and TobagoTurkeyUgandaUkraineUruguayUzbekistanVenezuelaVietnamWest IndiesWestern AfricaWestern AsiaWestern EuropeYemenZaireZimbabweAzores
Immigrants from Iran
Race
Ancestry
AfghanAfricanAlaska NativeAlaskan AthabascanAlbanianAleutAlsatianAmericanApacheArabArapahoArgentineanArmenianAssyrian/Chaldean/SyriacAustralianAustrianBahamianBangladeshiBarbadianBasqueBelgianBelizeanBermudanBhutaneseBlackfeetBolivianBrazilianBritishBritish West IndianBulgarianBurmeseCajunCambodianCanadianCape VerdeanCarpatho RusynCelticCentral AmericanCentral American IndianCherokeeCheyenneChickasawChileanChineseChippewaChoctawColombianColvilleComancheCosta RicanCreeCreekCroatianCrowCubanCypriotCzechCzechoslovakianDanishDelawareDominicanDutchDutch West IndianEastern EuropeanEcuadorianEgyptianEnglishEstonianEthiopianEuropeanFijianFilipinoFinnishFrenchFrench American IndianGermanGerman RussianGhanaianGreekGuamanian/ChamorroGuatemalanGuyaneseHaitianHmongHonduranHopiHoumaHungarianIcelanderIndian (Asian)IndonesianInupiatIranianIraqiIrishIroquoisIsraeliItalianJamaicanJapaneseJordanianKenyanKiowaKoreanLaotianLatvianLebaneseLiberianLithuanianLumbeeLuxembourgerMacedonianMalaysianMalteseMarshalleseMenomineeMexicanMexican American IndianMongolianMoroccanNative HawaiianNavajoNepaleseNew ZealanderNicaraguanNigerianNorthern EuropeanNorwegianOkinawanOsageOttawaPaiutePakistaniPalestinianPanamanianParaguayanPennsylvania GermanPeruvianPimaPolishPortuguesePotawatomiPuebloPuerto RicanPuget Sound SalishRomanianRussianSalvadoranSamoanScandinavianScotch-IrishScottishSeminoleSenegaleseSerbianShoshoneSierra LeoneanSiouxSlavicSlovakSloveneSomaliSouth AfricanSouth AmericanSouth American IndianSoviet UnionSpaniardSpanishSpanish AmericanSpanish American IndianSri LankanSubsaharan AfricanSudaneseSwedishSwissSyrianTaiwaneseThaiTlingit-HaidaTohono O'OdhamTonganTrinidadian and TobagonianTsimshianTurkishU.S. Virgin IslanderUgandanUkrainianUruguayanUteVenezuelanVietnameseWelshWest IndianYakamaYaquiYugoslavianYumanYup'ikZimbabwean
Immigration
NonimmigrantsImmigrantsAfghanistanAfricaAlbaniaArgentinaArmeniaAsiaAustraliaAustriaBahamasBangladeshBarbadosBelarusBelgiumBelizeBoliviaBosnia and HerzegovinaBrazilBulgariaBurma/MyanmarCabo VerdeCambodiaCameroonCanadaCaribbeanCentral AmericaChileChinaColombiaCongoCosta RicaCroatiaCubaCzechoslovakiaDenmarkDominicaDominican RepublicEastern AfricaEastern AsiaEastern EuropeEcuadorEgyptEl SalvadorEnglandEritreaEthiopiaEuropeFijiFranceGermanyGhanaGreeceGrenadaGuatemalaGuyanaHaitiHondurasHong KongHungaryIndiaIndonesiaIranIraqIrelandIsraelItalyJamaicaJapanJordanKazakhstanKenyaKoreaKuwaitLaosLatin AmericaLatviaLebanonLiberiaLithuaniaMalaysiaMexicoMicronesiaMiddle AfricaMoldovaMoroccoNepalNetherlandsNicaraguaNigeriaNorth AmericaNorth MacedoniaNorthern AfricaNorthern EuropeNorwayOceaniaPakistanPanamaPeruPhilippinesPolandPortugalRomaniaRussiaSaudi ArabiaScotlandSenegalSerbiaSierra LeoneSingaporeSomaliaSouth AfricaSouth AmericaSouth Central AsiaSouth Eastern AsiaSouthern EuropeSpainSri LankaSt. Vincent and the GrenadinesSudanSwedenSwitzerlandSyriaTaiwanThailandTrinidad and TobagoTurkeyUgandaUkraineUruguayUzbekistanVenezuelaVietnamWest IndiesWestern AfricaWestern AsiaWestern EuropeYemenZaireZimbabweAzores
Married-Couple Family Poverty
Income
Poverty
Unemployment
Labor Participation
Family Structure
Vehicle Availability
Education Level
Disability

Married-Couple Family Poverty Comparison

French Canadians

Immigrants from Iran

Exceptional
Exceptional
4.2%
MARRIED-COUPLE FAMILY POVERTY
99.8/ 100
METRIC RATING
40th/ 347
METRIC RANK
4.5%
MARRIED-COUPLE FAMILY POVERTY
99.0/ 100
METRIC RATING
79th/ 347
METRIC RANK

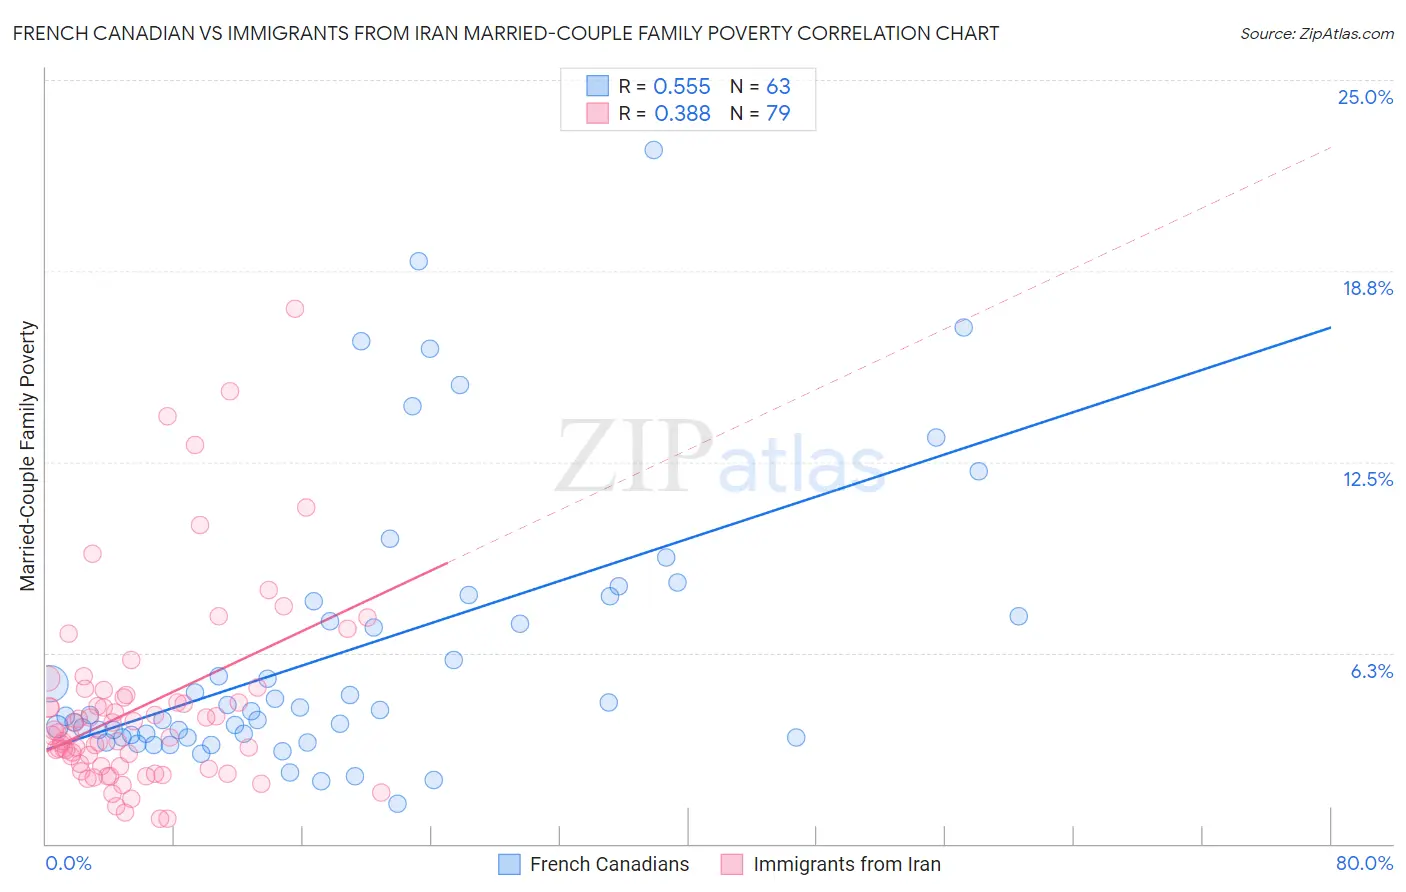
French Canadian vs Immigrants from Iran Married-Couple Family Poverty Correlation Chart

The statistical analysis conducted on geographies consisting of 493,719,375 people shows a substantial positive correlation between the proportion of French Canadians and poverty level among married-couple families in the United States with a correlation coefficient (R) of 0.555 and weighted average of 4.2%. Similarly, the statistical analysis conducted on geographies consisting of 278,379,218 people shows a mild positive correlation between the proportion of Immigrants from Iran and poverty level among married-couple families in the United States with a correlation coefficient (R) of 0.388 and weighted average of 4.5%, a difference of 6.5%.
French Canadian vs Immigrants from Iran Married-Couple Family Poverty

Married-Couple Family Poverty Correlation Summary

MeasurementFrench CanadianImmigrants from Iran
Minimum1.3%0.82%
Maximum22.7%17.5%
Range21.4%16.7%
Mean6.3%4.5%
Median4.3%3.5%
Interquartile 25% (IQ1)3.5%2.5%
Interquartile 75% (IQ3)8.0%4.9%
Interquartile Range (IQR)4.5%2.3%
Standard Deviation (Sample)4.6%3.2%
Standard Deviation (Population)4.6%3.2%

Similar Demographics by Married-Couple Family Poverty

Demographics Similar to French Canadians by Married-Couple Family Poverty

In terms of married-couple family poverty, the demographic groups most similar to French Canadians are Northern European (4.3%, a difference of 0.25%), Immigrants from Northern Europe (4.2%, a difference of 0.28%), Belgian (4.2%, a difference of 0.41%), Scottish (4.3%, a difference of 0.41%), and Iranian (4.2%, a difference of 0.53%).
DemographicsRating | RankMarried-Couple Family Poverty
Irish
99.9
/100
|
#33
Exceptional
4.2%
Dutch
99.9
/100
|
#34
Exceptional
4.2%
Europeans
99.9
/100
|
#35
Exceptional
4.2%
English
99.9
/100
|
#36
Exceptional
4.2%
Iranians
99.9
/100
|
#37
Exceptional
4.2%
Belgians
99.9
/100
|
#38
Exceptional
4.2%
Immigrants | Northern Europe
99.8
/100
|
#39
Exceptional
4.2%
French Canadians
99.8
/100
|
#40
Exceptional
4.2%
Northern Europeans
99.8
/100
|
#41
Exceptional
4.3%
Scottish
99.8
/100
|
#42
Exceptional
4.3%
Swiss
99.8
/100
|
#43
Exceptional
4.3%
Immigrants | Japan
99.8
/100
|
#44
Exceptional
4.3%
Serbians
99.8
/100
|
#45
Exceptional
4.3%
British
99.8
/100
|
#46
Exceptional
4.3%
Immigrants | South Central Asia
99.8
/100
|
#47
Exceptional
4.3%

Demographics Similar to Immigrants from Iran by Married-Couple Family Poverty

In terms of married-couple family poverty, the demographic groups most similar to Immigrants from Iran are Icelander (4.5%, a difference of 0.060%), Immigrants from Greece (4.5%, a difference of 0.20%), Scotch-Irish (4.5%, a difference of 0.23%), Immigrants from Latvia (4.5%, a difference of 0.31%), and Canadian (4.5%, a difference of 0.45%).
DemographicsRating | RankMarried-Couple Family Poverty
Immigrants | England
99.3
/100
|
#72
Exceptional
4.5%
Ukrainians
99.2
/100
|
#73
Exceptional
4.5%
Immigrants | Austria
99.2
/100
|
#74
Exceptional
4.5%
Cambodians
99.2
/100
|
#75
Exceptional
4.5%
Immigrants | South Africa
99.1
/100
|
#76
Exceptional
4.5%
Immigrants | Latvia
99.1
/100
|
#77
Exceptional
4.5%
Scotch-Irish
99.1
/100
|
#78
Exceptional
4.5%
Immigrants | Iran
99.0
/100
|
#79
Exceptional
4.5%
Icelanders
99.0
/100
|
#80
Exceptional
4.5%
Immigrants | Greece
98.9
/100
|
#81
Exceptional
4.5%
Canadians
98.8
/100
|
#82
Exceptional
4.5%
Immigrants | Denmark
98.8
/100
|
#83
Exceptional
4.6%
Immigrants | Croatia
98.7
/100
|
#84
Exceptional
4.6%
South Africans
98.7
/100
|
#85
Exceptional
4.6%
Immigrants | Turkey
98.6
/100
|
#86
Exceptional
4.6%