French Canadian vs Immigrants from Vietnam Married-Couple Family Poverty
COMPARE
French Canadian
Immigrants from Vietnam
Married-Couple Family Poverty
Married-Couple Family Poverty Comparison
French Canadians
Immigrants from Vietnam
4.2%
MARRIED-COUPLE FAMILY POVERTY
99.8/ 100
METRIC RATING
40th/ 347
METRIC RANK
5.3%
MARRIED-COUPLE FAMILY POVERTY
37.7/ 100
METRIC RATING
182nd/ 347
METRIC RANK
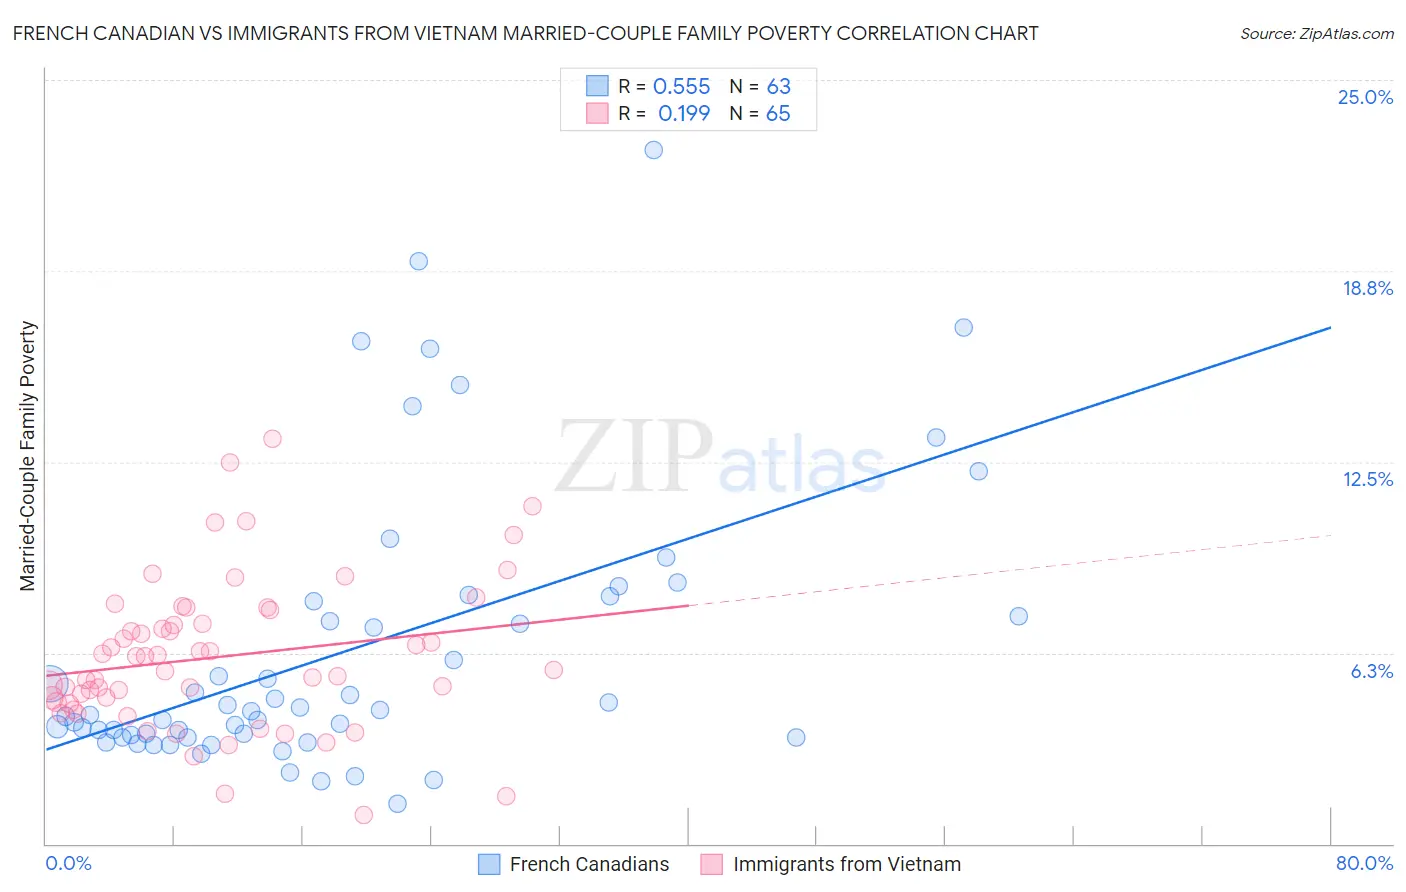
French Canadian vs Immigrants from Vietnam Married-Couple Family Poverty Correlation Chart
The statistical analysis conducted on geographies consisting of 493,719,375 people shows a substantial positive correlation between the proportion of French Canadians and poverty level among married-couple families in the United States with a correlation coefficient (R) of 0.555 and weighted average of 4.2%. Similarly, the statistical analysis conducted on geographies consisting of 401,742,374 people shows a poor positive correlation between the proportion of Immigrants from Vietnam and poverty level among married-couple families in the United States with a correlation coefficient (R) of 0.199 and weighted average of 5.3%, a difference of 24.6%.
Married-Couple Family Poverty Correlation Summary
| Measurement | French Canadian | Immigrants from Vietnam |
| Minimum | 1.3% | 0.96% |
| Maximum | 22.7% | 13.2% |
| Range | 21.4% | 12.3% |
| Mean | 6.3% | 6.1% |
| Median | 4.3% | 5.7% |
| Interquartile 25% (IQ1) | 3.5% | 4.6% |
| Interquartile 75% (IQ3) | 8.0% | 7.4% |
| Interquartile Range (IQR) | 4.5% | 2.8% |
| Standard Deviation (Sample) | 4.6% | 2.4% |
| Standard Deviation (Population) | 4.6% | 2.4% |
Similar Demographics by Married-Couple Family Poverty
Demographics Similar to French Canadians by Married-Couple Family Poverty
In terms of married-couple family poverty, the demographic groups most similar to French Canadians are Northern European (4.3%, a difference of 0.25%), Immigrants from Northern Europe (4.2%, a difference of 0.28%), Belgian (4.2%, a difference of 0.41%), Scottish (4.3%, a difference of 0.41%), and Iranian (4.2%, a difference of 0.53%).
| Demographics | Rating | Rank | Married-Couple Family Poverty |
| Irish | 99.9 /100 | #33 | Exceptional 4.2% |
| Dutch | 99.9 /100 | #34 | Exceptional 4.2% |
| Europeans | 99.9 /100 | #35 | Exceptional 4.2% |
| English | 99.9 /100 | #36 | Exceptional 4.2% |
| Iranians | 99.9 /100 | #37 | Exceptional 4.2% |
| Belgians | 99.9 /100 | #38 | Exceptional 4.2% |
| Immigrants | Northern Europe | 99.8 /100 | #39 | Exceptional 4.2% |
| French Canadians | 99.8 /100 | #40 | Exceptional 4.2% |
| Northern Europeans | 99.8 /100 | #41 | Exceptional 4.3% |
| Scottish | 99.8 /100 | #42 | Exceptional 4.3% |
| Swiss | 99.8 /100 | #43 | Exceptional 4.3% |
| Immigrants | Japan | 99.8 /100 | #44 | Exceptional 4.3% |
| Serbians | 99.8 /100 | #45 | Exceptional 4.3% |
| British | 99.8 /100 | #46 | Exceptional 4.3% |
| Immigrants | South Central Asia | 99.8 /100 | #47 | Exceptional 4.3% |
Demographics Similar to Immigrants from Vietnam by Married-Couple Family Poverty
In terms of married-couple family poverty, the demographic groups most similar to Immigrants from Vietnam are Peruvian (5.3%, a difference of 0.010%), Immigrants from Chile (5.3%, a difference of 0.13%), Immigrants from Sierra Leone (5.3%, a difference of 0.18%), Nonimmigrants (5.3%, a difference of 0.24%), and American (5.3%, a difference of 0.29%).
| Demographics | Rating | Rank | Married-Couple Family Poverty |
| Marshallese | 47.9 /100 | #175 | Average 5.2% |
| Menominee | 47.8 /100 | #176 | Average 5.2% |
| Immigrants | Kazakhstan | 45.1 /100 | #177 | Average 5.2% |
| Immigrants | Ukraine | 44.9 /100 | #178 | Average 5.2% |
| Spanish | 41.4 /100 | #179 | Average 5.3% |
| Immigrants | Sierra Leone | 39.3 /100 | #180 | Fair 5.3% |
| Immigrants | Chile | 38.8 /100 | #181 | Fair 5.3% |
| Immigrants | Vietnam | 37.7 /100 | #182 | Fair 5.3% |
| Peruvians | 37.6 /100 | #183 | Fair 5.3% |
| Immigrants | Nonimmigrants | 35.8 /100 | #184 | Fair 5.3% |
| Americans | 35.4 /100 | #185 | Fair 5.3% |
| Hungarians | 34.7 /100 | #186 | Fair 5.3% |
| Immigrants | Albania | 33.8 /100 | #187 | Fair 5.3% |
| Israelis | 33.1 /100 | #188 | Fair 5.3% |
| South American Indians | 32.5 /100 | #189 | Fair 5.3% |