French Canadian vs Immigrants from France Married-Couple Family Poverty
COMPARE
French Canadian
Immigrants from France
Married-Couple Family Poverty
Married-Couple Family Poverty Comparison
French Canadians
Immigrants from France
4.2%
MARRIED-COUPLE FAMILY POVERTY
99.8/ 100
METRIC RATING
40th/ 347
METRIC RANK
4.7%
MARRIED-COUPLE FAMILY POVERTY
96.9/ 100
METRIC RATING
106th/ 347
METRIC RANK
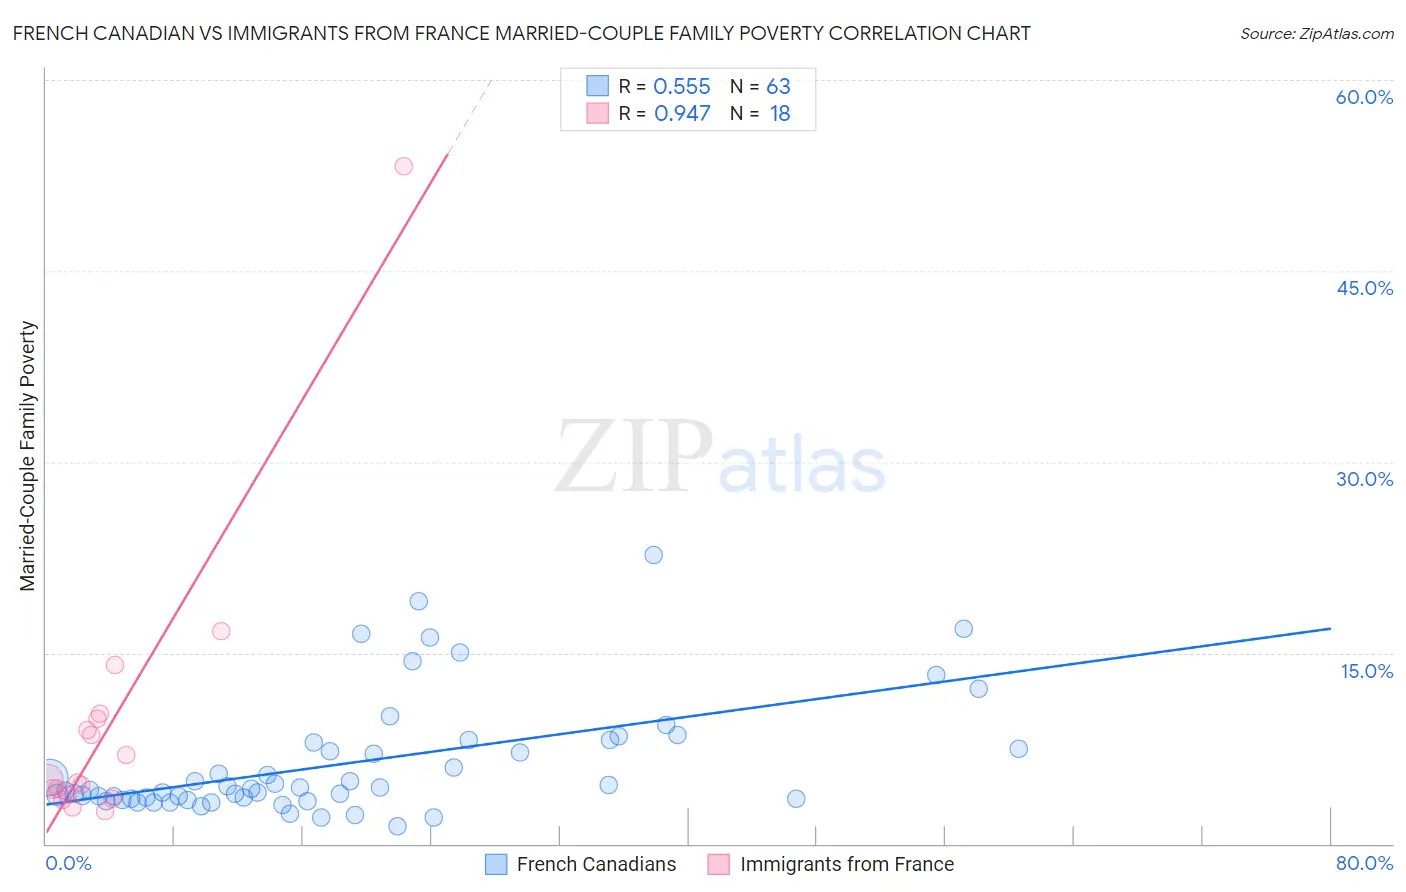
French Canadian vs Immigrants from France Married-Couple Family Poverty Correlation Chart
The statistical analysis conducted on geographies consisting of 493,719,375 people shows a substantial positive correlation between the proportion of French Canadians and poverty level among married-couple families in the United States with a correlation coefficient (R) of 0.555 and weighted average of 4.2%. Similarly, the statistical analysis conducted on geographies consisting of 285,965,344 people shows a near-perfect positive correlation between the proportion of Immigrants from France and poverty level among married-couple families in the United States with a correlation coefficient (R) of 0.947 and weighted average of 4.7%, a difference of 10.6%.
Married-Couple Family Poverty Correlation Summary
| Measurement | French Canadian | Immigrants from France |
| Minimum | 1.3% | 2.5% |
| Maximum | 22.7% | 53.2% |
| Range | 21.4% | 50.7% |
| Mean | 6.3% | 9.3% |
| Median | 4.3% | 4.9% |
| Interquartile 25% (IQ1) | 3.5% | 3.8% |
| Interquartile 75% (IQ3) | 8.0% | 9.9% |
| Interquartile Range (IQR) | 4.5% | 6.0% |
| Standard Deviation (Sample) | 4.6% | 11.6% |
| Standard Deviation (Population) | 4.6% | 11.3% |
Similar Demographics by Married-Couple Family Poverty
Demographics Similar to French Canadians by Married-Couple Family Poverty
In terms of married-couple family poverty, the demographic groups most similar to French Canadians are Northern European (4.3%, a difference of 0.25%), Immigrants from Northern Europe (4.2%, a difference of 0.28%), Belgian (4.2%, a difference of 0.41%), Scottish (4.3%, a difference of 0.41%), and Iranian (4.2%, a difference of 0.53%).
| Demographics | Rating | Rank | Married-Couple Family Poverty |
| Irish | 99.9 /100 | #33 | Exceptional 4.2% |
| Dutch | 99.9 /100 | #34 | Exceptional 4.2% |
| Europeans | 99.9 /100 | #35 | Exceptional 4.2% |
| English | 99.9 /100 | #36 | Exceptional 4.2% |
| Iranians | 99.9 /100 | #37 | Exceptional 4.2% |
| Belgians | 99.9 /100 | #38 | Exceptional 4.2% |
| Immigrants | Northern Europe | 99.8 /100 | #39 | Exceptional 4.2% |
| French Canadians | 99.8 /100 | #40 | Exceptional 4.2% |
| Northern Europeans | 99.8 /100 | #41 | Exceptional 4.3% |
| Scottish | 99.8 /100 | #42 | Exceptional 4.3% |
| Swiss | 99.8 /100 | #43 | Exceptional 4.3% |
| Immigrants | Japan | 99.8 /100 | #44 | Exceptional 4.3% |
| Serbians | 99.8 /100 | #45 | Exceptional 4.3% |
| British | 99.8 /100 | #46 | Exceptional 4.3% |
| Immigrants | South Central Asia | 99.8 /100 | #47 | Exceptional 4.3% |
Demographics Similar to Immigrants from France by Married-Couple Family Poverty
In terms of married-couple family poverty, the demographic groups most similar to Immigrants from France are Immigrants from Germany (4.7%, a difference of 0.010%), Aleut (4.7%, a difference of 0.15%), Immigrants from Moldova (4.7%, a difference of 0.23%), Laotian (4.7%, a difference of 0.27%), and Immigrants from Hong Kong (4.7%, a difference of 0.48%).
| Demographics | Rating | Rank | Married-Couple Family Poverty |
| Immigrants | Europe | 97.9 /100 | #99 | Exceptional 4.6% |
| Immigrants | Western Europe | 97.9 /100 | #100 | Exceptional 4.6% |
| Yugoslavians | 97.8 /100 | #101 | Exceptional 4.6% |
| Asians | 97.6 /100 | #102 | Exceptional 4.7% |
| Immigrants | Romania | 97.3 /100 | #103 | Exceptional 4.7% |
| Immigrants | Moldova | 97.1 /100 | #104 | Exceptional 4.7% |
| Aleuts | 97.0 /100 | #105 | Exceptional 4.7% |
| Immigrants | France | 96.9 /100 | #106 | Exceptional 4.7% |
| Immigrants | Germany | 96.8 /100 | #107 | Exceptional 4.7% |
| Laotians | 96.6 /100 | #108 | Exceptional 4.7% |
| Immigrants | Hong Kong | 96.4 /100 | #109 | Exceptional 4.7% |
| Immigrants | Bolivia | 96.2 /100 | #110 | Exceptional 4.7% |
| Pakistanis | 96.2 /100 | #111 | Exceptional 4.7% |
| Tongans | 95.9 /100 | #112 | Exceptional 4.7% |
| Immigrants | Nepal | 95.9 /100 | #113 | Exceptional 4.7% |