Filipino vs Luxembourger Single Female Poverty
COMPARE
Filipino
Luxembourger
Single Female Poverty
Single Female Poverty Comparison
Filipinos
Luxembourgers
17.0%
SINGLE FEMALE POVERTY
100.0/ 100
METRIC RATING
6th/ 347
METRIC RANK
20.4%
SINGLE FEMALE POVERTY
84.9/ 100
METRIC RATING
148th/ 347
METRIC RANK
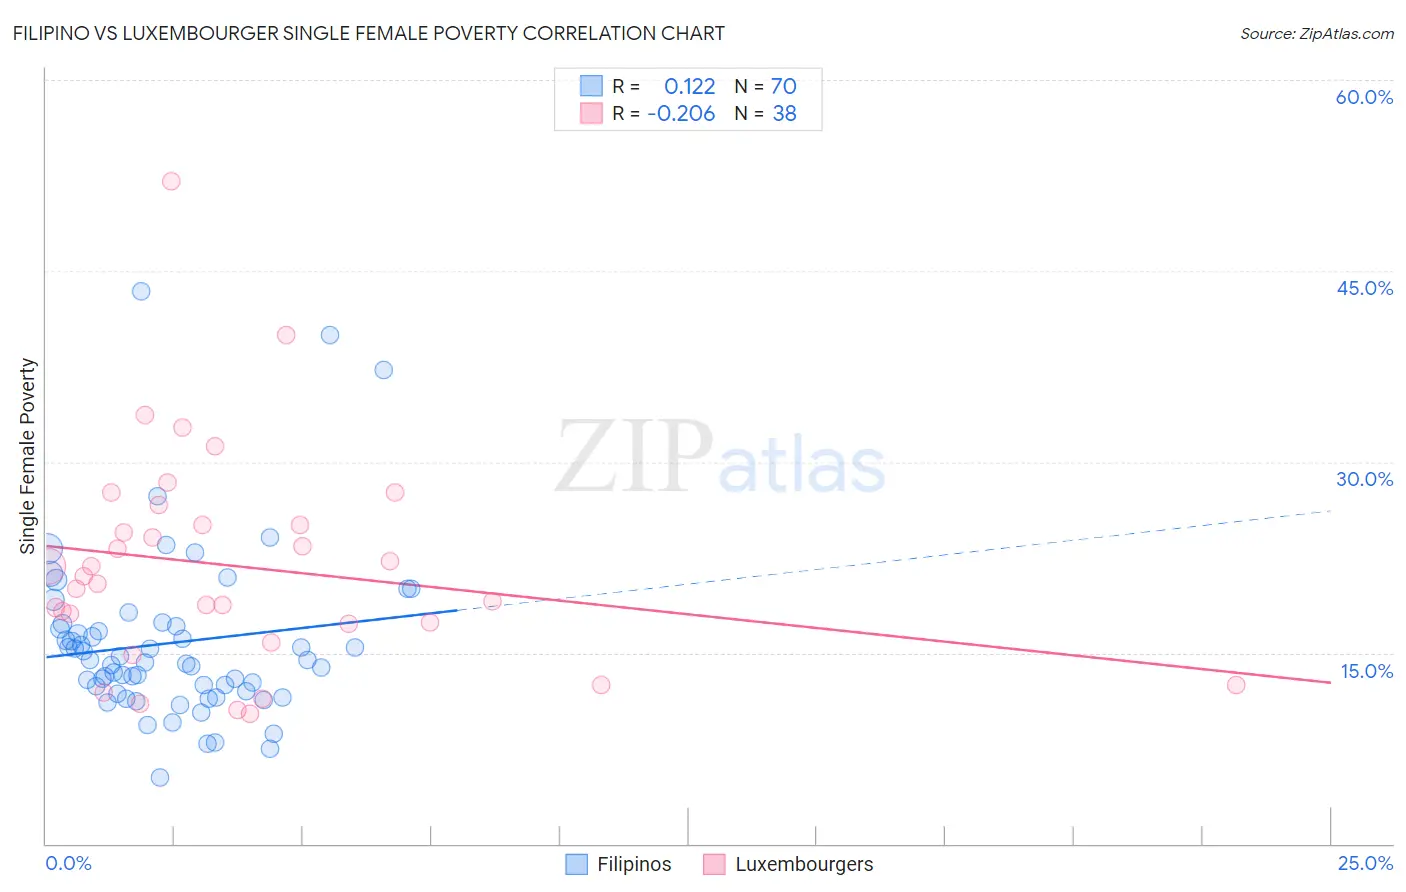
Filipino vs Luxembourger Single Female Poverty Correlation Chart
The statistical analysis conducted on geographies consisting of 251,336,668 people shows a poor positive correlation between the proportion of Filipinos and poverty level among single females in the United States with a correlation coefficient (R) of 0.122 and weighted average of 17.0%. Similarly, the statistical analysis conducted on geographies consisting of 143,364,483 people shows a weak negative correlation between the proportion of Luxembourgers and poverty level among single females in the United States with a correlation coefficient (R) of -0.206 and weighted average of 20.4%, a difference of 20.3%.
Single Female Poverty Correlation Summary
| Measurement | Filipino | Luxembourger |
| Minimum | 5.2% | 10.2% |
| Maximum | 43.4% | 52.1% |
| Range | 38.2% | 41.9% |
| Mean | 15.8% | 21.8% |
| Median | 14.3% | 20.7% |
| Interquartile 25% (IQ1) | 12.0% | 17.3% |
| Interquartile 75% (IQ3) | 17.1% | 25.0% |
| Interquartile Range (IQR) | 5.1% | 7.7% |
| Standard Deviation (Sample) | 6.7% | 8.6% |
| Standard Deviation (Population) | 6.7% | 8.5% |
Similar Demographics by Single Female Poverty
Demographics Similar to Filipinos by Single Female Poverty
In terms of single female poverty, the demographic groups most similar to Filipinos are Assyrian/Chaldean/Syriac (17.0%, a difference of 0.20%), Immigrants from India (16.8%, a difference of 1.0%), Thai (17.3%, a difference of 1.7%), Immigrants from Iran (17.5%, a difference of 2.8%), and Immigrants from Hong Kong (16.5%, a difference of 2.8%).
| Demographics | Rating | Rank | Single Female Poverty |
| Chinese | 100.0 /100 | #1 | Exceptional 16.1% |
| Immigrants | Taiwan | 100.0 /100 | #2 | Exceptional 16.4% |
| Immigrants | Hong Kong | 100.0 /100 | #3 | Exceptional 16.5% |
| Immigrants | India | 100.0 /100 | #4 | Exceptional 16.8% |
| Assyrians/Chaldeans/Syriacs | 100.0 /100 | #5 | Exceptional 17.0% |
| Filipinos | 100.0 /100 | #6 | Exceptional 17.0% |
| Thais | 100.0 /100 | #7 | Exceptional 17.3% |
| Immigrants | Iran | 100.0 /100 | #8 | Exceptional 17.5% |
| Bhutanese | 100.0 /100 | #9 | Exceptional 17.7% |
| Immigrants | Ireland | 100.0 /100 | #10 | Exceptional 17.8% |
| Immigrants | Lithuania | 100.0 /100 | #11 | Exceptional 17.8% |
| Immigrants | South Central Asia | 100.0 /100 | #12 | Exceptional 17.8% |
| Immigrants | Bolivia | 100.0 /100 | #13 | Exceptional 17.8% |
| Bolivians | 100.0 /100 | #14 | Exceptional 17.9% |
| Indians (Asian) | 100.0 /100 | #15 | Exceptional 17.9% |
Demographics Similar to Luxembourgers by Single Female Poverty
In terms of single female poverty, the demographic groups most similar to Luxembourgers are South African (20.4%, a difference of 0.050%), Venezuelan (20.4%, a difference of 0.080%), Austrian (20.4%, a difference of 0.11%), Portuguese (20.5%, a difference of 0.39%), and Immigrants from Uzbekistan (20.3%, a difference of 0.47%).
| Demographics | Rating | Rank | Single Female Poverty |
| Immigrants | North America | 89.5 /100 | #141 | Excellent 20.3% |
| Immigrants | Uganda | 89.1 /100 | #142 | Excellent 20.3% |
| Australians | 88.4 /100 | #143 | Excellent 20.3% |
| Immigrants | Uzbekistan | 88.3 /100 | #144 | Excellent 20.3% |
| Austrians | 85.8 /100 | #145 | Excellent 20.4% |
| Venezuelans | 85.5 /100 | #146 | Excellent 20.4% |
| South Africans | 85.3 /100 | #147 | Excellent 20.4% |
| Luxembourgers | 84.9 /100 | #148 | Excellent 20.4% |
| Portuguese | 81.5 /100 | #149 | Excellent 20.5% |
| Immigrants | Denmark | 80.5 /100 | #150 | Excellent 20.5% |
| Puget Sound Salish | 79.6 /100 | #151 | Good 20.6% |
| Immigrants | Uruguay | 77.7 /100 | #152 | Good 20.6% |
| Swedes | 77.1 /100 | #153 | Good 20.6% |
| Immigrants | Western Europe | 76.7 /100 | #154 | Good 20.6% |
| Samoans | 76.0 /100 | #155 | Good 20.6% |