Filipino vs Mexican American Indian Single Female Poverty
COMPARE
Filipino
Mexican American Indian
Single Female Poverty
Single Female Poverty Comparison
Filipinos
Mexican American Indians
17.0%
SINGLE FEMALE POVERTY
100.0/ 100
METRIC RATING
6th/ 347
METRIC RANK
23.4%
SINGLE FEMALE POVERTY
0.1/ 100
METRIC RATING
275th/ 347
METRIC RANK
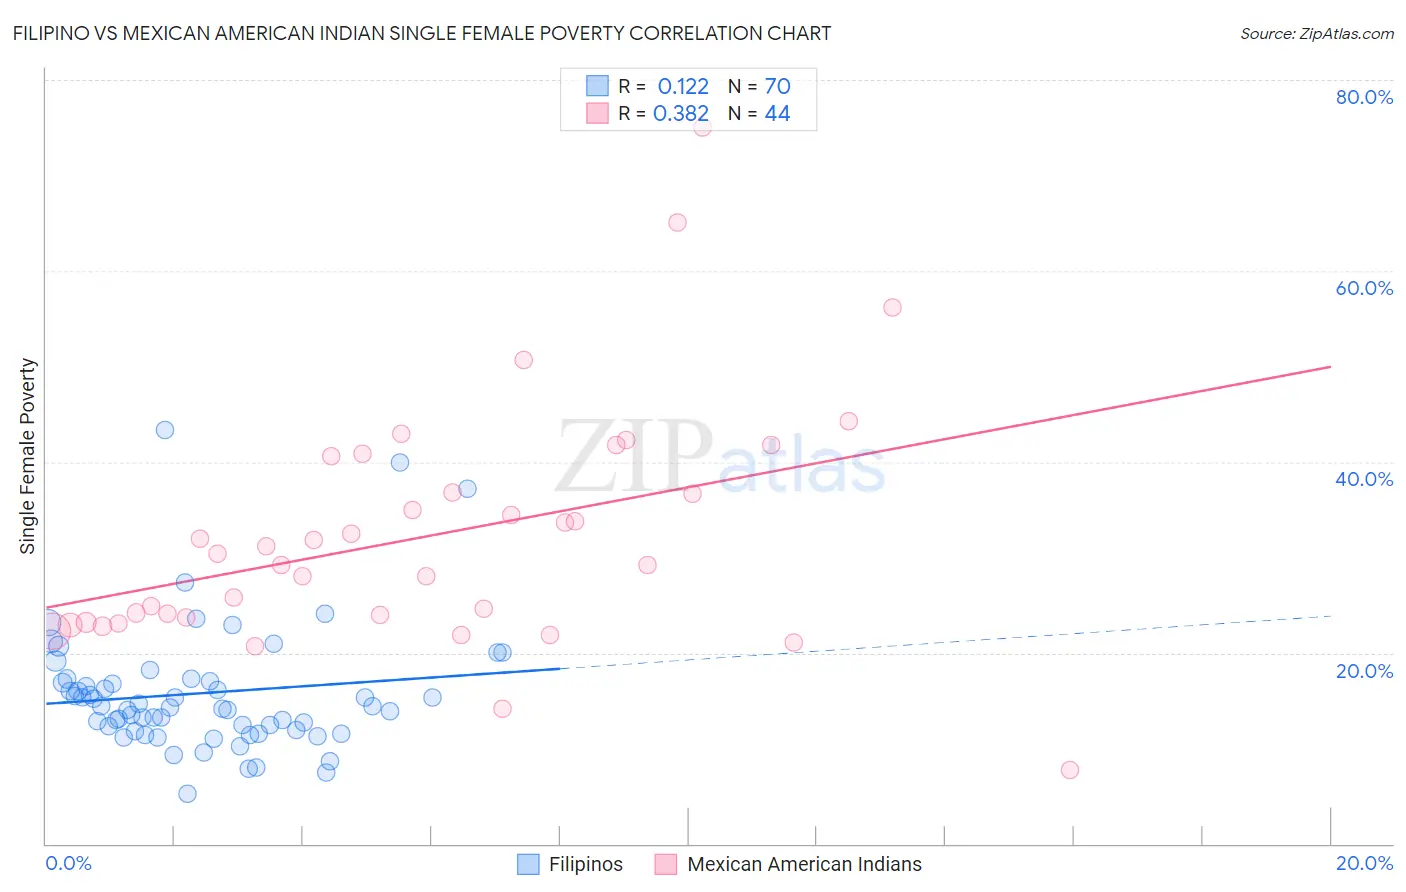
Filipino vs Mexican American Indian Single Female Poverty Correlation Chart
The statistical analysis conducted on geographies consisting of 251,336,668 people shows a poor positive correlation between the proportion of Filipinos and poverty level among single females in the United States with a correlation coefficient (R) of 0.122 and weighted average of 17.0%. Similarly, the statistical analysis conducted on geographies consisting of 315,510,714 people shows a mild positive correlation between the proportion of Mexican American Indians and poverty level among single females in the United States with a correlation coefficient (R) of 0.382 and weighted average of 23.4%, a difference of 37.5%.
Single Female Poverty Correlation Summary
| Measurement | Filipino | Mexican American Indian |
| Minimum | 5.2% | 7.7% |
| Maximum | 43.4% | 75.0% |
| Range | 38.2% | 67.3% |
| Mean | 15.8% | 32.2% |
| Median | 14.3% | 29.8% |
| Interquartile 25% (IQ1) | 12.0% | 23.5% |
| Interquartile 75% (IQ3) | 17.1% | 38.6% |
| Interquartile Range (IQR) | 5.1% | 15.2% |
| Standard Deviation (Sample) | 6.7% | 12.7% |
| Standard Deviation (Population) | 6.7% | 12.5% |
Similar Demographics by Single Female Poverty
Demographics Similar to Filipinos by Single Female Poverty
In terms of single female poverty, the demographic groups most similar to Filipinos are Assyrian/Chaldean/Syriac (17.0%, a difference of 0.20%), Immigrants from India (16.8%, a difference of 1.0%), Thai (17.3%, a difference of 1.7%), Immigrants from Iran (17.5%, a difference of 2.8%), and Immigrants from Hong Kong (16.5%, a difference of 2.8%).
| Demographics | Rating | Rank | Single Female Poverty |
| Chinese | 100.0 /100 | #1 | Exceptional 16.1% |
| Immigrants | Taiwan | 100.0 /100 | #2 | Exceptional 16.4% |
| Immigrants | Hong Kong | 100.0 /100 | #3 | Exceptional 16.5% |
| Immigrants | India | 100.0 /100 | #4 | Exceptional 16.8% |
| Assyrians/Chaldeans/Syriacs | 100.0 /100 | #5 | Exceptional 17.0% |
| Filipinos | 100.0 /100 | #6 | Exceptional 17.0% |
| Thais | 100.0 /100 | #7 | Exceptional 17.3% |
| Immigrants | Iran | 100.0 /100 | #8 | Exceptional 17.5% |
| Bhutanese | 100.0 /100 | #9 | Exceptional 17.7% |
| Immigrants | Ireland | 100.0 /100 | #10 | Exceptional 17.8% |
| Immigrants | Lithuania | 100.0 /100 | #11 | Exceptional 17.8% |
| Immigrants | South Central Asia | 100.0 /100 | #12 | Exceptional 17.8% |
| Immigrants | Bolivia | 100.0 /100 | #13 | Exceptional 17.8% |
| Bolivians | 100.0 /100 | #14 | Exceptional 17.9% |
| Indians (Asian) | 100.0 /100 | #15 | Exceptional 17.9% |
Demographics Similar to Mexican American Indians by Single Female Poverty
In terms of single female poverty, the demographic groups most similar to Mexican American Indians are Alaska Native (23.3%, a difference of 0.27%), Marshallese (23.3%, a difference of 0.27%), Immigrants from Senegal (23.2%, a difference of 0.53%), Subsaharan African (23.2%, a difference of 0.71%), and Immigrants from the Azores (23.5%, a difference of 0.78%).
| Demographics | Rating | Rank | Single Female Poverty |
| Fijians | 0.2 /100 | #268 | Tragic 23.1% |
| Hmong | 0.2 /100 | #269 | Tragic 23.1% |
| Inupiat | 0.2 /100 | #270 | Tragic 23.1% |
| Sub-Saharan Africans | 0.1 /100 | #271 | Tragic 23.2% |
| Immigrants | Senegal | 0.1 /100 | #272 | Tragic 23.2% |
| Alaska Natives | 0.1 /100 | #273 | Tragic 23.3% |
| Marshallese | 0.1 /100 | #274 | Tragic 23.3% |
| Mexican American Indians | 0.1 /100 | #275 | Tragic 23.4% |
| Immigrants | Azores | 0.0 /100 | #276 | Tragic 23.5% |
| Pennsylvania Germans | 0.0 /100 | #277 | Tragic 23.6% |
| Immigrants | Nonimmigrants | 0.0 /100 | #278 | Tragic 23.6% |
| Alaskan Athabascans | 0.0 /100 | #279 | Tragic 23.6% |
| Immigrants | Latin America | 0.0 /100 | #280 | Tragic 23.7% |
| Immigrants | Zaire | 0.0 /100 | #281 | Tragic 23.8% |
| Guatemalans | 0.0 /100 | #282 | Tragic 23.8% |