Filipino vs Indonesian Single Female Poverty
COMPARE
Filipino
Indonesian
Single Female Poverty
Single Female Poverty Comparison
Filipinos
Indonesians
17.0%
SINGLE FEMALE POVERTY
100.0/ 100
METRIC RATING
6th/ 347
METRIC RANK
24.3%
SINGLE FEMALE POVERTY
0.0/ 100
METRIC RATING
290th/ 347
METRIC RANK
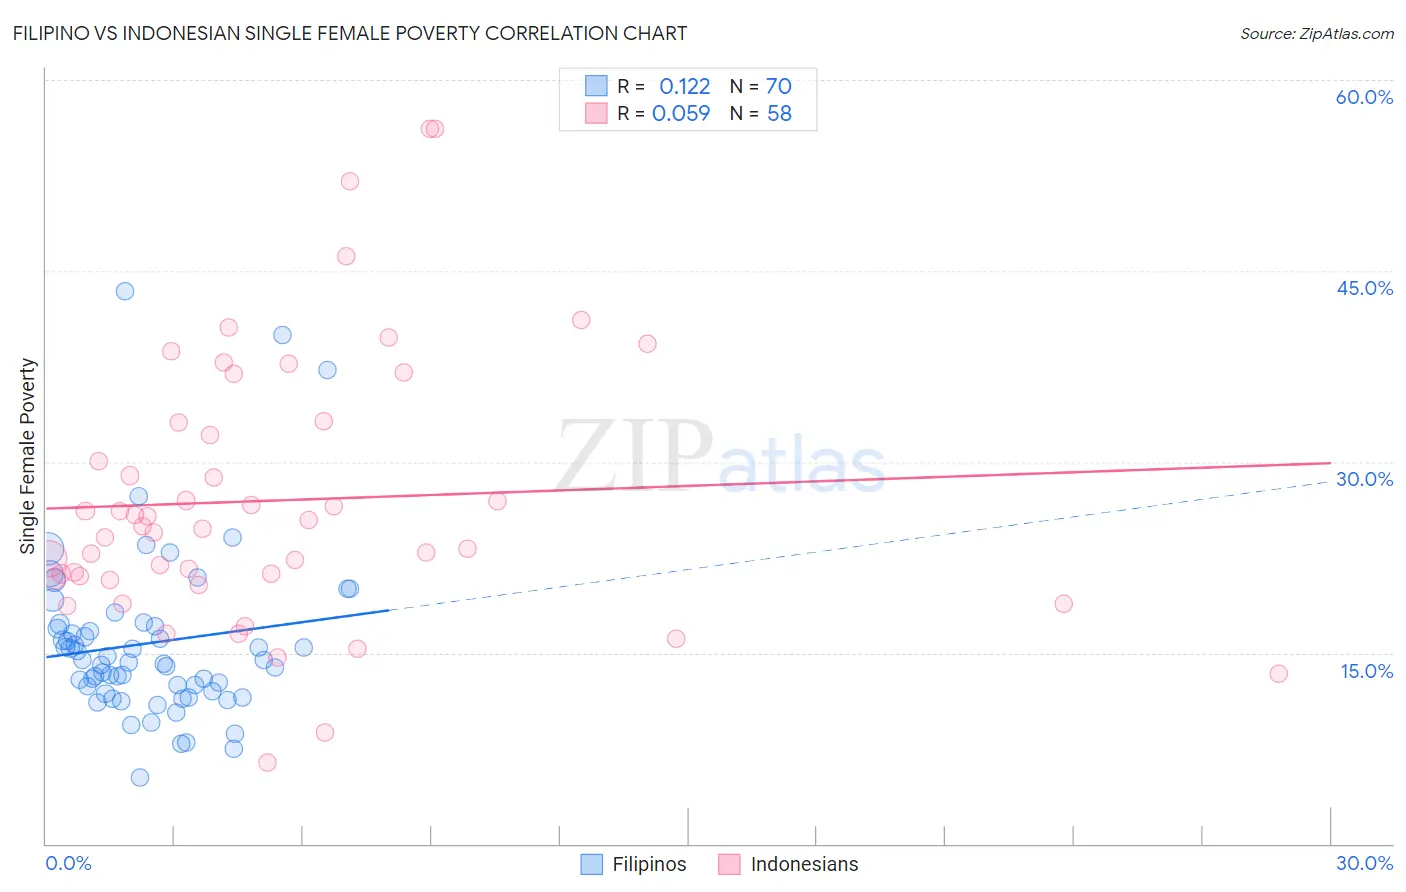
Filipino vs Indonesian Single Female Poverty Correlation Chart
The statistical analysis conducted on geographies consisting of 251,336,668 people shows a poor positive correlation between the proportion of Filipinos and poverty level among single females in the United States with a correlation coefficient (R) of 0.122 and weighted average of 17.0%. Similarly, the statistical analysis conducted on geographies consisting of 161,765,451 people shows a slight positive correlation between the proportion of Indonesians and poverty level among single females in the United States with a correlation coefficient (R) of 0.059 and weighted average of 24.3%, a difference of 42.8%.
Single Female Poverty Correlation Summary
| Measurement | Filipino | Indonesian |
| Minimum | 5.2% | 6.4% |
| Maximum | 43.4% | 56.2% |
| Range | 38.2% | 49.8% |
| Mean | 15.8% | 27.0% |
| Median | 14.3% | 24.8% |
| Interquartile 25% (IQ1) | 12.0% | 20.8% |
| Interquartile 75% (IQ3) | 17.1% | 33.1% |
| Interquartile Range (IQR) | 5.1% | 12.3% |
| Standard Deviation (Sample) | 6.7% | 10.6% |
| Standard Deviation (Population) | 6.7% | 10.5% |
Similar Demographics by Single Female Poverty
Demographics Similar to Filipinos by Single Female Poverty
In terms of single female poverty, the demographic groups most similar to Filipinos are Assyrian/Chaldean/Syriac (17.0%, a difference of 0.20%), Immigrants from India (16.8%, a difference of 1.0%), Thai (17.3%, a difference of 1.7%), Immigrants from Iran (17.5%, a difference of 2.8%), and Immigrants from Hong Kong (16.5%, a difference of 2.8%).
| Demographics | Rating | Rank | Single Female Poverty |
| Chinese | 100.0 /100 | #1 | Exceptional 16.1% |
| Immigrants | Taiwan | 100.0 /100 | #2 | Exceptional 16.4% |
| Immigrants | Hong Kong | 100.0 /100 | #3 | Exceptional 16.5% |
| Immigrants | India | 100.0 /100 | #4 | Exceptional 16.8% |
| Assyrians/Chaldeans/Syriacs | 100.0 /100 | #5 | Exceptional 17.0% |
| Filipinos | 100.0 /100 | #6 | Exceptional 17.0% |
| Thais | 100.0 /100 | #7 | Exceptional 17.3% |
| Immigrants | Iran | 100.0 /100 | #8 | Exceptional 17.5% |
| Bhutanese | 100.0 /100 | #9 | Exceptional 17.7% |
| Immigrants | Ireland | 100.0 /100 | #10 | Exceptional 17.8% |
| Immigrants | Lithuania | 100.0 /100 | #11 | Exceptional 17.8% |
| Immigrants | South Central Asia | 100.0 /100 | #12 | Exceptional 17.8% |
| Immigrants | Bolivia | 100.0 /100 | #13 | Exceptional 17.8% |
| Bolivians | 100.0 /100 | #14 | Exceptional 17.9% |
| Indians (Asian) | 100.0 /100 | #15 | Exceptional 17.9% |
Demographics Similar to Indonesians by Single Female Poverty
In terms of single female poverty, the demographic groups most similar to Indonesians are U.S. Virgin Islander (24.2%, a difference of 0.34%), Spanish American (24.2%, a difference of 0.40%), Bangladeshi (24.2%, a difference of 0.41%), Cree (24.1%, a difference of 0.57%), and Immigrants from Guatemala (24.1%, a difference of 0.60%).
| Demographics | Rating | Rank | Single Female Poverty |
| German Russians | 0.0 /100 | #283 | Tragic 23.9% |
| Immigrants | Dominica | 0.0 /100 | #284 | Tragic 23.9% |
| Immigrants | Guatemala | 0.0 /100 | #285 | Tragic 24.1% |
| Cree | 0.0 /100 | #286 | Tragic 24.1% |
| Bangladeshis | 0.0 /100 | #287 | Tragic 24.2% |
| Spanish Americans | 0.0 /100 | #288 | Tragic 24.2% |
| U.S. Virgin Islanders | 0.0 /100 | #289 | Tragic 24.2% |
| Indonesians | 0.0 /100 | #290 | Tragic 24.3% |
| Osage | 0.0 /100 | #291 | Tragic 24.4% |
| Alsatians | 0.0 /100 | #292 | Tragic 24.5% |
| Americans | 0.0 /100 | #293 | Tragic 24.5% |
| French American Indians | 0.0 /100 | #294 | Tragic 24.6% |
| Hispanics or Latinos | 0.0 /100 | #295 | Tragic 24.6% |
| Africans | 0.0 /100 | #296 | Tragic 24.8% |
| Immigrants | Central America | 0.0 /100 | #297 | Tragic 24.8% |