Filipino vs Luxembourger Unemployment Among Ages 35 to 44 years
COMPARE
Filipino
Luxembourger
Unemployment Among Ages 35 to 44 years
Unemployment Among Ages 35 to 44 years Comparison
Filipinos
Luxembourgers
4.0%
UNEMPLOYMENT AMONG AGES 35 TO 44 YEARS
100.0/ 100
METRIC RATING
5th/ 347
METRIC RANK
4.3%
UNEMPLOYMENT AMONG AGES 35 TO 44 YEARS
99.0/ 100
METRIC RATING
35th/ 347
METRIC RANK
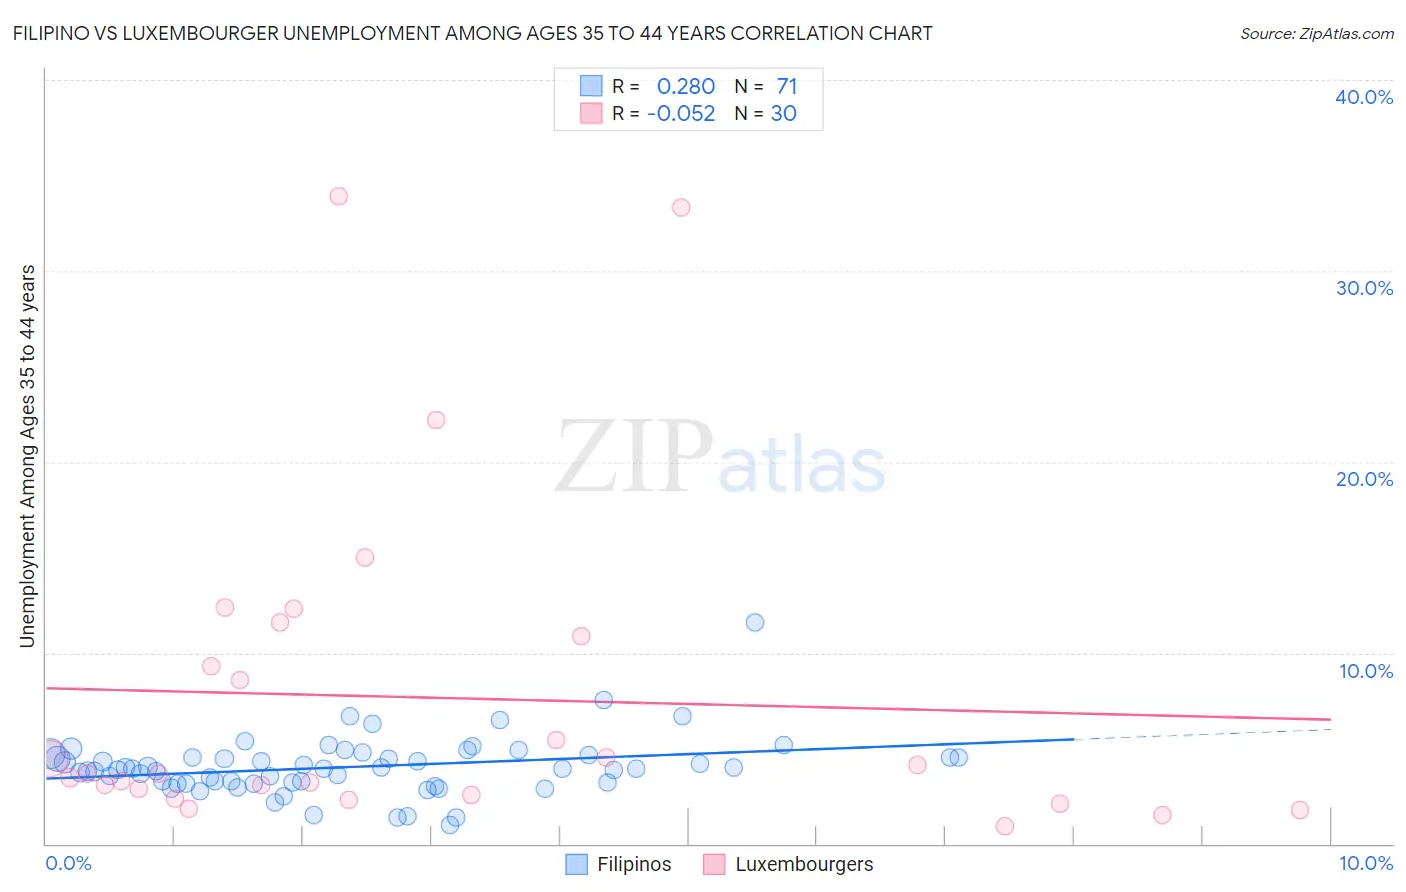
Filipino vs Luxembourger Unemployment Among Ages 35 to 44 years Correlation Chart
The statistical analysis conducted on geographies consisting of 251,340,709 people shows a weak positive correlation between the proportion of Filipinos and unemployment rate among population between the ages 35 and 44 in the United States with a correlation coefficient (R) of 0.280 and weighted average of 4.0%. Similarly, the statistical analysis conducted on geographies consisting of 142,430,740 people shows a slight negative correlation between the proportion of Luxembourgers and unemployment rate among population between the ages 35 and 44 in the United States with a correlation coefficient (R) of -0.052 and weighted average of 4.3%, a difference of 6.6%.
Unemployment Among Ages 35 to 44 years Correlation Summary
| Measurement | Filipino | Luxembourger |
| Minimum | 1.0% | 0.90% |
| Maximum | 11.6% | 33.9% |
| Range | 10.6% | 33.0% |
| Mean | 4.0% | 7.7% |
| Median | 3.9% | 3.7% |
| Interquartile 25% (IQ1) | 3.2% | 2.6% |
| Interquartile 75% (IQ3) | 4.5% | 10.9% |
| Interquartile Range (IQR) | 1.3% | 8.3% |
| Standard Deviation (Sample) | 1.5% | 8.6% |
| Standard Deviation (Population) | 1.5% | 8.4% |
Similar Demographics by Unemployment Among Ages 35 to 44 years
Demographics Similar to Filipinos by Unemployment Among Ages 35 to 44 years
In terms of unemployment among ages 35 to 44 years, the demographic groups most similar to Filipinos are Immigrants from Venezuela (4.0%, a difference of 0.090%), Immigrants from Taiwan (4.0%, a difference of 0.66%), Immigrants from Cuba (4.1%, a difference of 0.90%), Norwegian (4.0%, a difference of 1.2%), and Immigrants from South Central Asia (4.1%, a difference of 1.5%).
| Demographics | Rating | Rank | Unemployment Among Ages 35 to 44 years |
| Immigrants | India | 100.0 /100 | #1 | Exceptional 3.8% |
| Thais | 100.0 /100 | #2 | Exceptional 3.9% |
| Norwegians | 100.0 /100 | #3 | Exceptional 4.0% |
| Immigrants | Taiwan | 100.0 /100 | #4 | Exceptional 4.0% |
| Filipinos | 100.0 /100 | #5 | Exceptional 4.0% |
| Immigrants | Venezuela | 100.0 /100 | #6 | Exceptional 4.0% |
| Immigrants | Cuba | 99.9 /100 | #7 | Exceptional 4.1% |
| Immigrants | South Central Asia | 99.9 /100 | #8 | Exceptional 4.1% |
| Danes | 99.9 /100 | #9 | Exceptional 4.1% |
| Immigrants | Singapore | 99.9 /100 | #10 | Exceptional 4.1% |
| Sudanese | 99.9 /100 | #11 | Exceptional 4.1% |
| Venezuelans | 99.9 /100 | #12 | Exceptional 4.1% |
| Bolivians | 99.9 /100 | #13 | Exceptional 4.1% |
| Czechs | 99.9 /100 | #14 | Exceptional 4.1% |
| Tongans | 99.8 /100 | #15 | Exceptional 4.2% |
Demographics Similar to Luxembourgers by Unemployment Among Ages 35 to 44 years
In terms of unemployment among ages 35 to 44 years, the demographic groups most similar to Luxembourgers are Jordanian (4.3%, a difference of 0.030%), Mongolian (4.3%, a difference of 0.10%), Immigrants from Zimbabwe (4.3%, a difference of 0.15%), Immigrants from Sri Lanka (4.3%, a difference of 0.18%), and Burmese (4.3%, a difference of 0.22%).
| Demographics | Rating | Rank | Unemployment Among Ages 35 to 44 years |
| Immigrants | Japan | 99.3 /100 | #28 | Exceptional 4.3% |
| Europeans | 99.2 /100 | #29 | Exceptional 4.3% |
| Immigrants | Pakistan | 99.2 /100 | #30 | Exceptional 4.3% |
| Carpatho Rusyns | 99.2 /100 | #31 | Exceptional 4.3% |
| Chinese | 99.1 /100 | #32 | Exceptional 4.3% |
| Immigrants | Sri Lanka | 99.1 /100 | #33 | Exceptional 4.3% |
| Jordanians | 99.0 /100 | #34 | Exceptional 4.3% |
| Luxembourgers | 99.0 /100 | #35 | Exceptional 4.3% |
| Mongolians | 98.9 /100 | #36 | Exceptional 4.3% |
| Immigrants | Zimbabwe | 98.9 /100 | #37 | Exceptional 4.3% |
| Burmese | 98.9 /100 | #38 | Exceptional 4.3% |
| Palestinians | 98.8 /100 | #39 | Exceptional 4.3% |
| Zimbabweans | 98.8 /100 | #40 | Exceptional 4.3% |
| Belgians | 98.7 /100 | #41 | Exceptional 4.3% |
| Germans | 98.7 /100 | #42 | Exceptional 4.3% |