Filipino vs Immigrants from France Single Female Poverty
COMPARE
Filipino
Immigrants from France
Single Female Poverty
Single Female Poverty Comparison
Filipinos
Immigrants from France
17.0%
SINGLE FEMALE POVERTY
100.0/ 100
METRIC RATING
6th/ 347
METRIC RANK
19.7%
SINGLE FEMALE POVERTY
97.9/ 100
METRIC RATING
98th/ 347
METRIC RANK
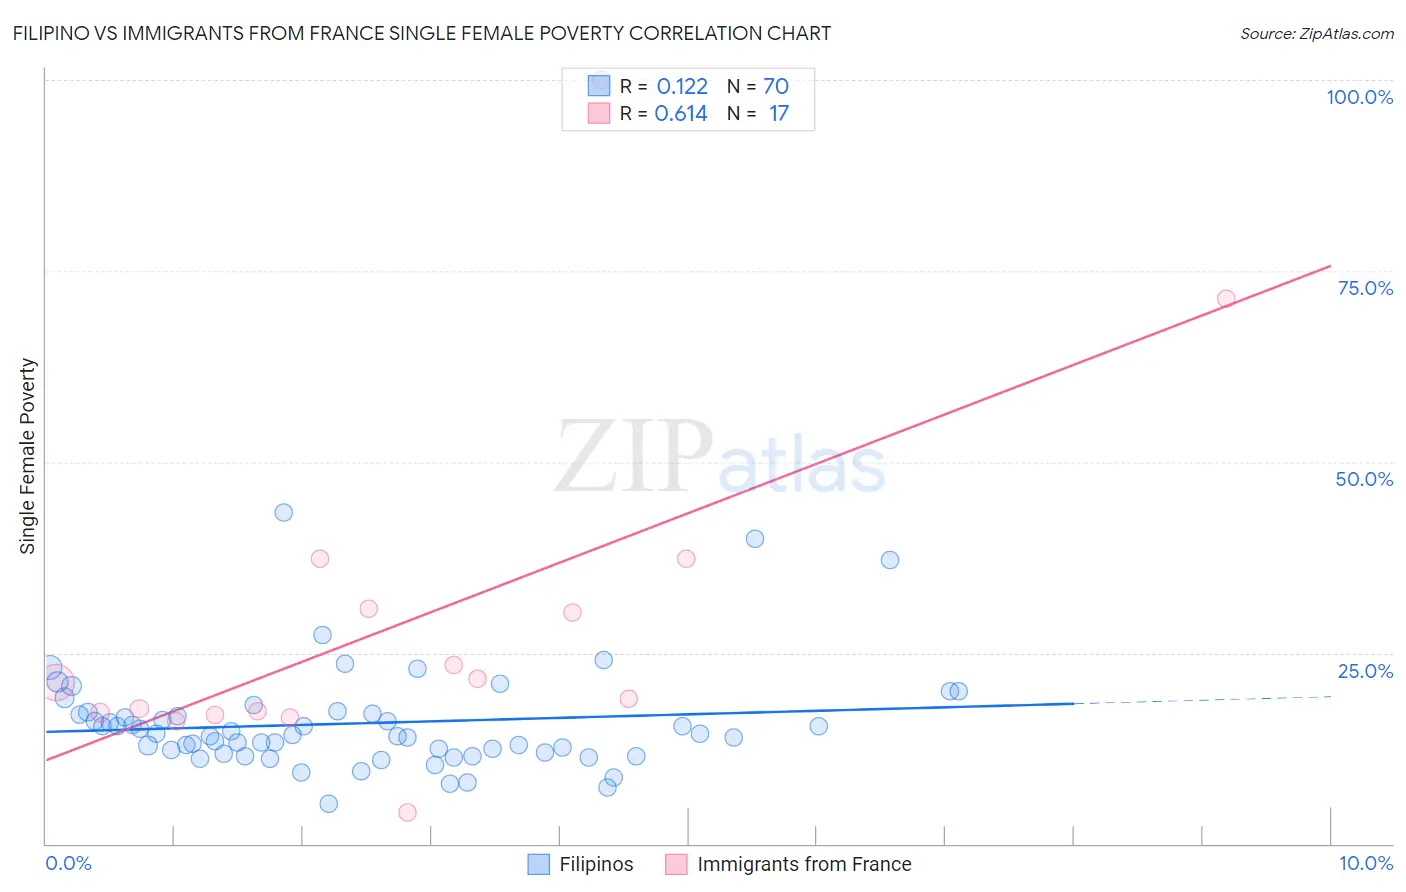
Filipino vs Immigrants from France Single Female Poverty Correlation Chart
The statistical analysis conducted on geographies consisting of 251,336,668 people shows a poor positive correlation between the proportion of Filipinos and poverty level among single females in the United States with a correlation coefficient (R) of 0.122 and weighted average of 17.0%. Similarly, the statistical analysis conducted on geographies consisting of 284,213,175 people shows a significant positive correlation between the proportion of Immigrants from France and poverty level among single females in the United States with a correlation coefficient (R) of 0.614 and weighted average of 19.7%, a difference of 16.3%.
Single Female Poverty Correlation Summary
| Measurement | Filipino | Immigrants from France |
| Minimum | 5.2% | 4.0% |
| Maximum | 43.4% | 100.0% |
| Range | 38.2% | 96.0% |
| Mean | 15.8% | 29.3% |
| Median | 14.3% | 21.1% |
| Interquartile 25% (IQ1) | 12.0% | 17.0% |
| Interquartile 75% (IQ3) | 17.1% | 34.0% |
| Interquartile Range (IQR) | 5.1% | 17.0% |
| Standard Deviation (Sample) | 6.7% | 23.4% |
| Standard Deviation (Population) | 6.7% | 22.7% |
Similar Demographics by Single Female Poverty
Demographics Similar to Filipinos by Single Female Poverty
In terms of single female poverty, the demographic groups most similar to Filipinos are Assyrian/Chaldean/Syriac (17.0%, a difference of 0.20%), Immigrants from India (16.8%, a difference of 1.0%), Thai (17.3%, a difference of 1.7%), Immigrants from Iran (17.5%, a difference of 2.8%), and Immigrants from Hong Kong (16.5%, a difference of 2.8%).
| Demographics | Rating | Rank | Single Female Poverty |
| Chinese | 100.0 /100 | #1 | Exceptional 16.1% |
| Immigrants | Taiwan | 100.0 /100 | #2 | Exceptional 16.4% |
| Immigrants | Hong Kong | 100.0 /100 | #3 | Exceptional 16.5% |
| Immigrants | India | 100.0 /100 | #4 | Exceptional 16.8% |
| Assyrians/Chaldeans/Syriacs | 100.0 /100 | #5 | Exceptional 17.0% |
| Filipinos | 100.0 /100 | #6 | Exceptional 17.0% |
| Thais | 100.0 /100 | #7 | Exceptional 17.3% |
| Immigrants | Iran | 100.0 /100 | #8 | Exceptional 17.5% |
| Bhutanese | 100.0 /100 | #9 | Exceptional 17.7% |
| Immigrants | Ireland | 100.0 /100 | #10 | Exceptional 17.8% |
| Immigrants | Lithuania | 100.0 /100 | #11 | Exceptional 17.8% |
| Immigrants | South Central Asia | 100.0 /100 | #12 | Exceptional 17.8% |
| Immigrants | Bolivia | 100.0 /100 | #13 | Exceptional 17.8% |
| Bolivians | 100.0 /100 | #14 | Exceptional 17.9% |
| Indians (Asian) | 100.0 /100 | #15 | Exceptional 17.9% |
Demographics Similar to Immigrants from France by Single Female Poverty
In terms of single female poverty, the demographic groups most similar to Immigrants from France are Sierra Leonean (19.7%, a difference of 0.010%), Croatian (19.7%, a difference of 0.13%), Immigrants from Brazil (19.7%, a difference of 0.21%), Estonian (19.7%, a difference of 0.26%), and Ukrainian (19.8%, a difference of 0.26%).
| Demographics | Rating | Rank | Single Female Poverty |
| Soviet Union | 98.8 /100 | #91 | Exceptional 19.6% |
| Italians | 98.8 /100 | #92 | Exceptional 19.6% |
| Immigrants | Austria | 98.8 /100 | #93 | Exceptional 19.6% |
| Romanians | 98.6 /100 | #94 | Exceptional 19.6% |
| Estonians | 98.2 /100 | #95 | Exceptional 19.7% |
| Immigrants | Brazil | 98.2 /100 | #96 | Exceptional 19.7% |
| Croatians | 98.1 /100 | #97 | Exceptional 19.7% |
| Immigrants | France | 97.9 /100 | #98 | Exceptional 19.7% |
| Sierra Leoneans | 97.9 /100 | #99 | Exceptional 19.7% |
| Ukrainians | 97.6 /100 | #100 | Exceptional 19.8% |
| Immigrants | Belgium | 97.3 /100 | #101 | Exceptional 19.8% |
| Immigrants | Cameroon | 97.3 /100 | #102 | Exceptional 19.8% |
| Immigrants | Southern Europe | 97.1 /100 | #103 | Exceptional 19.9% |
| Chileans | 96.9 /100 | #104 | Exceptional 19.9% |
| Israelis | 96.9 /100 | #105 | Exceptional 19.9% |