Filipino vs Laotian Single Female Poverty
COMPARE
Filipino
Laotian
Single Female Poverty
Single Female Poverty Comparison
Filipinos
Laotians
17.0%
SINGLE FEMALE POVERTY
100.0/ 100
METRIC RATING
6th/ 347
METRIC RANK
19.3%
SINGLE FEMALE POVERTY
99.5/ 100
METRIC RATING
68th/ 347
METRIC RANK
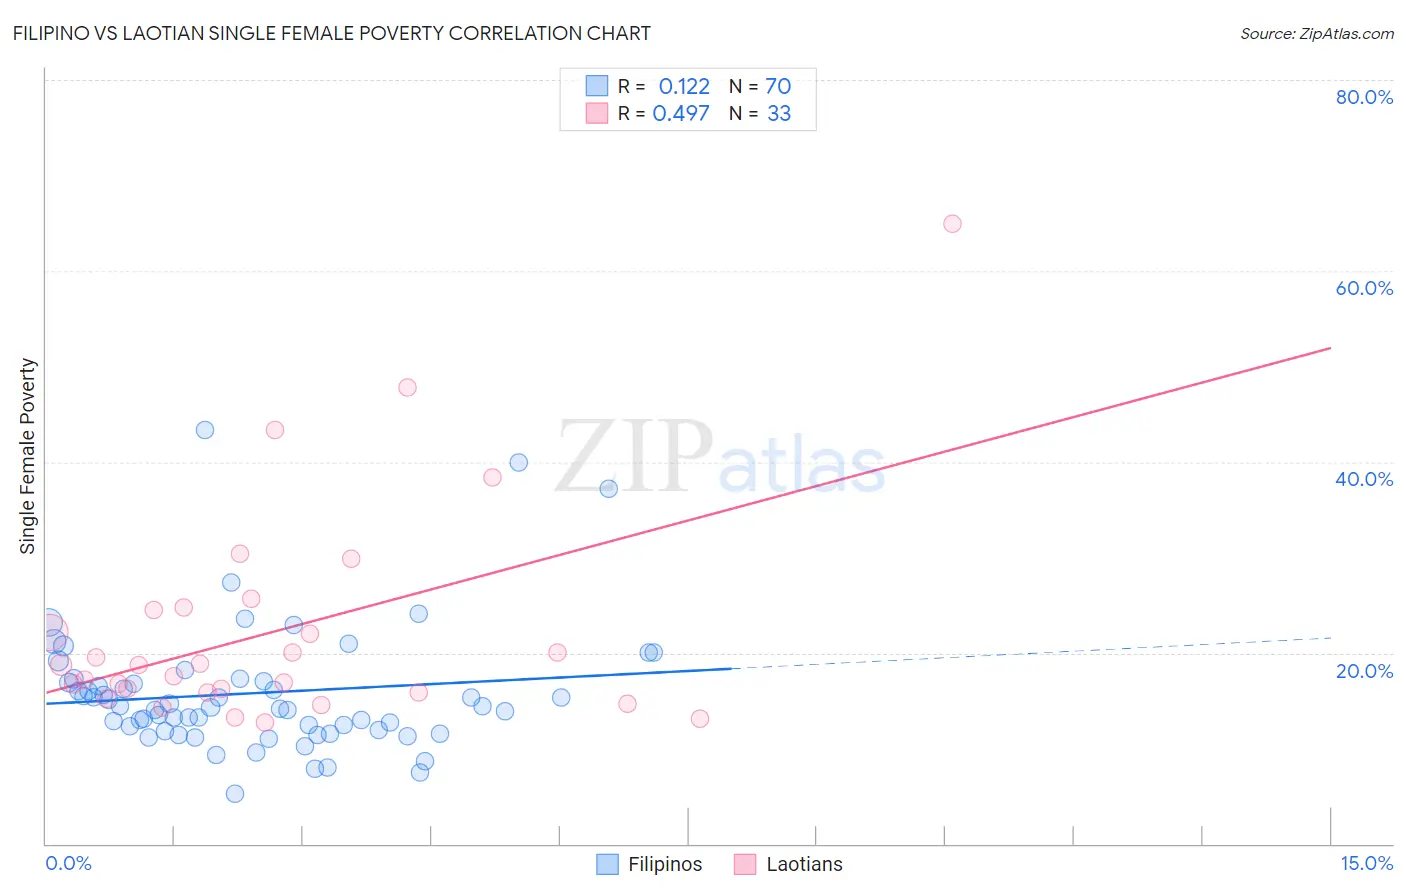
Filipino vs Laotian Single Female Poverty Correlation Chart
The statistical analysis conducted on geographies consisting of 251,336,668 people shows a poor positive correlation between the proportion of Filipinos and poverty level among single females in the United States with a correlation coefficient (R) of 0.122 and weighted average of 17.0%. Similarly, the statistical analysis conducted on geographies consisting of 222,876,805 people shows a moderate positive correlation between the proportion of Laotians and poverty level among single females in the United States with a correlation coefficient (R) of 0.497 and weighted average of 19.3%, a difference of 13.3%.
Single Female Poverty Correlation Summary
| Measurement | Filipino | Laotian |
| Minimum | 5.2% | 12.6% |
| Maximum | 43.4% | 64.9% |
| Range | 38.2% | 52.3% |
| Mean | 15.8% | 22.3% |
| Median | 14.3% | 18.7% |
| Interquartile 25% (IQ1) | 12.0% | 15.9% |
| Interquartile 75% (IQ3) | 17.1% | 24.6% |
| Interquartile Range (IQR) | 5.1% | 8.7% |
| Standard Deviation (Sample) | 6.7% | 11.4% |
| Standard Deviation (Population) | 6.7% | 11.2% |
Similar Demographics by Single Female Poverty
Demographics Similar to Filipinos by Single Female Poverty
In terms of single female poverty, the demographic groups most similar to Filipinos are Assyrian/Chaldean/Syriac (17.0%, a difference of 0.20%), Immigrants from India (16.8%, a difference of 1.0%), Thai (17.3%, a difference of 1.7%), Immigrants from Iran (17.5%, a difference of 2.8%), and Immigrants from Hong Kong (16.5%, a difference of 2.8%).
| Demographics | Rating | Rank | Single Female Poverty |
| Chinese | 100.0 /100 | #1 | Exceptional 16.1% |
| Immigrants | Taiwan | 100.0 /100 | #2 | Exceptional 16.4% |
| Immigrants | Hong Kong | 100.0 /100 | #3 | Exceptional 16.5% |
| Immigrants | India | 100.0 /100 | #4 | Exceptional 16.8% |
| Assyrians/Chaldeans/Syriacs | 100.0 /100 | #5 | Exceptional 17.0% |
| Filipinos | 100.0 /100 | #6 | Exceptional 17.0% |
| Thais | 100.0 /100 | #7 | Exceptional 17.3% |
| Immigrants | Iran | 100.0 /100 | #8 | Exceptional 17.5% |
| Bhutanese | 100.0 /100 | #9 | Exceptional 17.7% |
| Immigrants | Ireland | 100.0 /100 | #10 | Exceptional 17.8% |
| Immigrants | Lithuania | 100.0 /100 | #11 | Exceptional 17.8% |
| Immigrants | South Central Asia | 100.0 /100 | #12 | Exceptional 17.8% |
| Immigrants | Bolivia | 100.0 /100 | #13 | Exceptional 17.8% |
| Bolivians | 100.0 /100 | #14 | Exceptional 17.9% |
| Indians (Asian) | 100.0 /100 | #15 | Exceptional 17.9% |
Demographics Similar to Laotians by Single Female Poverty
In terms of single female poverty, the demographic groups most similar to Laotians are Immigrants from Egypt (19.2%, a difference of 0.040%), Palestinian (19.2%, a difference of 0.080%), Cypriot (19.2%, a difference of 0.10%), Immigrants from Europe (19.2%, a difference of 0.12%), and Immigrants from Northern Europe (19.2%, a difference of 0.13%).
| Demographics | Rating | Rank | Single Female Poverty |
| Cambodians | 99.6 /100 | #61 | Exceptional 19.2% |
| Lithuanians | 99.6 /100 | #62 | Exceptional 19.2% |
| Immigrants | Northern Europe | 99.6 /100 | #63 | Exceptional 19.2% |
| Immigrants | Europe | 99.6 /100 | #64 | Exceptional 19.2% |
| Cypriots | 99.6 /100 | #65 | Exceptional 19.2% |
| Palestinians | 99.6 /100 | #66 | Exceptional 19.2% |
| Immigrants | Egypt | 99.6 /100 | #67 | Exceptional 19.2% |
| Laotians | 99.5 /100 | #68 | Exceptional 19.3% |
| Paraguayans | 99.5 /100 | #69 | Exceptional 19.3% |
| Immigrants | Jordan | 99.4 /100 | #70 | Exceptional 19.3% |
| Immigrants | South Eastern Asia | 99.4 /100 | #71 | Exceptional 19.3% |
| Immigrants | Latvia | 99.4 /100 | #72 | Exceptional 19.3% |
| Immigrants | Peru | 99.4 /100 | #73 | Exceptional 19.3% |
| Immigrants | Belarus | 99.4 /100 | #74 | Exceptional 19.3% |
| Immigrants | Turkey | 99.4 /100 | #75 | Exceptional 19.4% |