Filipino vs Luxembourger Male Unemployment
COMPARE
Filipino
Luxembourger
Male Unemployment
Male Unemployment Comparison
Filipinos
Luxembourgers
4.7%
MALE UNEMPLOYMENT
99.9/ 100
METRIC RATING
17th/ 347
METRIC RANK
4.5%
MALE UNEMPLOYMENT
100.0/ 100
METRIC RATING
8th/ 347
METRIC RANK
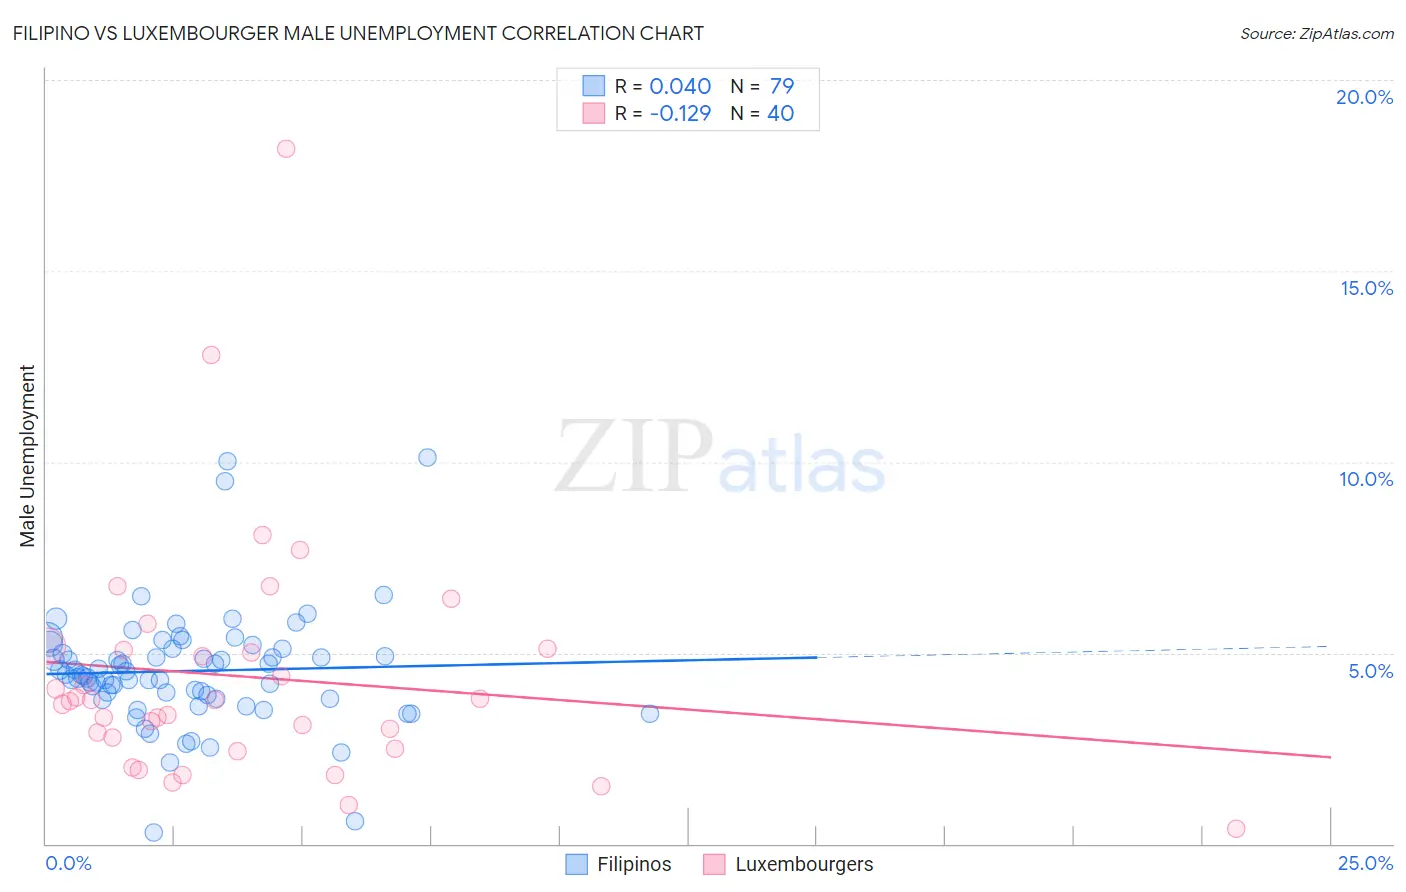
Filipino vs Luxembourger Male Unemployment Correlation Chart
The statistical analysis conducted on geographies consisting of 253,897,394 people shows no correlation between the proportion of Filipinos and unemployment rate among males in the United States with a correlation coefficient (R) of 0.040 and weighted average of 4.7%. Similarly, the statistical analysis conducted on geographies consisting of 144,259,966 people shows a poor negative correlation between the proportion of Luxembourgers and unemployment rate among males in the United States with a correlation coefficient (R) of -0.129 and weighted average of 4.5%, a difference of 4.5%.
Male Unemployment Correlation Summary
| Measurement | Filipino | Luxembourger |
| Minimum | 0.30% | 0.40% |
| Maximum | 10.1% | 18.2% |
| Range | 9.8% | 17.8% |
| Mean | 4.5% | 4.4% |
| Median | 4.4% | 3.8% |
| Interquartile 25% (IQ1) | 3.8% | 2.6% |
| Interquartile 75% (IQ3) | 5.1% | 5.1% |
| Interquartile Range (IQR) | 1.3% | 2.5% |
| Standard Deviation (Sample) | 1.5% | 3.2% |
| Standard Deviation (Population) | 1.5% | 3.2% |
Demographics Similar to Filipinos and Luxembourgers by Male Unemployment
In terms of male unemployment, the demographic groups most similar to Filipinos are English (4.8%, a difference of 0.30%), European (4.8%, a difference of 0.32%), Pennsylvania German (4.8%, a difference of 0.38%), Immigrants from Taiwan (4.8%, a difference of 0.54%), and Carpatho Rusyn (4.8%, a difference of 0.55%). Similarly, the demographic groups most similar to Luxembourgers are Czech (4.5%, a difference of 0.26%), Venezuelan (4.5%, a difference of 0.46%), Danish (4.5%, a difference of 0.91%), Thai (4.6%, a difference of 1.2%), and Cuban (4.6%, a difference of 1.8%).
| Demographics | Rating | Rank | Male Unemployment |
| Immigrants | Cuba | 100.0 /100 | #2 | Exceptional 4.4% |
| Norwegians | 100.0 /100 | #3 | Exceptional 4.4% |
| Immigrants | Venezuela | 100.0 /100 | #4 | Exceptional 4.4% |
| Danes | 100.0 /100 | #5 | Exceptional 4.5% |
| Venezuelans | 100.0 /100 | #6 | Exceptional 4.5% |
| Czechs | 100.0 /100 | #7 | Exceptional 4.5% |
| Luxembourgers | 100.0 /100 | #8 | Exceptional 4.5% |
| Thais | 100.0 /100 | #9 | Exceptional 4.6% |
| Cubans | 100.0 /100 | #10 | Exceptional 4.6% |
| Swedes | 100.0 /100 | #11 | Exceptional 4.6% |
| Immigrants | Bolivia | 100.0 /100 | #12 | Exceptional 4.7% |
| Bolivians | 100.0 /100 | #13 | Exceptional 4.7% |
| Germans | 100.0 /100 | #14 | Exceptional 4.7% |
| Scandinavians | 100.0 /100 | #15 | Exceptional 4.7% |
| Swiss | 99.9 /100 | #16 | Exceptional 4.7% |
| Filipinos | 99.9 /100 | #17 | Exceptional 4.7% |
| English | 99.9 /100 | #18 | Exceptional 4.8% |
| Europeans | 99.9 /100 | #19 | Exceptional 4.8% |
| Pennsylvania Germans | 99.9 /100 | #20 | Exceptional 4.8% |
| Immigrants | Taiwan | 99.9 /100 | #21 | Exceptional 4.8% |
| Carpatho Rusyns | 99.9 /100 | #22 | Exceptional 4.8% |