Fijian vs Native Hawaiian Male Poverty
COMPARE
Fijian
Native Hawaiian
Male Poverty
Male Poverty Comparison
Fijians
Native Hawaiians
12.6%
MALE POVERTY
0.6/ 100
METRIC RATING
233rd/ 347
METRIC RANK
10.7%
MALE POVERTY
87.0/ 100
METRIC RATING
122nd/ 347
METRIC RANK
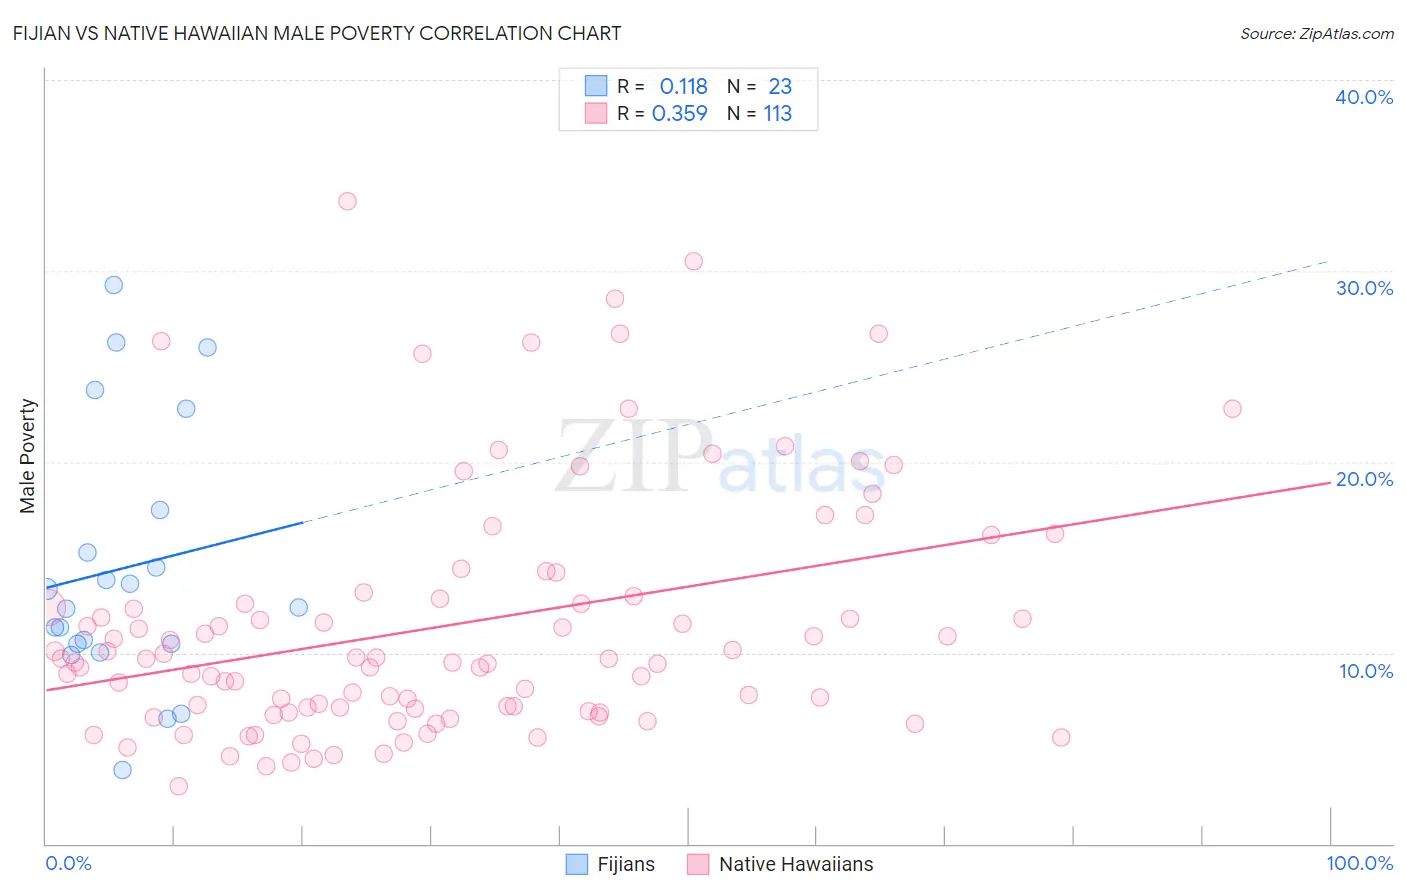
Fijian vs Native Hawaiian Male Poverty Correlation Chart
The statistical analysis conducted on geographies consisting of 55,945,809 people shows a poor positive correlation between the proportion of Fijians and poverty level among males in the United States with a correlation coefficient (R) of 0.118 and weighted average of 12.6%. Similarly, the statistical analysis conducted on geographies consisting of 331,823,706 people shows a mild positive correlation between the proportion of Native Hawaiians and poverty level among males in the United States with a correlation coefficient (R) of 0.359 and weighted average of 10.7%, a difference of 18.0%.
Male Poverty Correlation Summary
| Measurement | Fijian | Native Hawaiian |
| Minimum | 3.8% | 3.0% |
| Maximum | 29.3% | 33.7% |
| Range | 25.4% | 30.7% |
| Mean | 14.4% | 11.4% |
| Median | 12.4% | 9.7% |
| Interquartile 25% (IQ1) | 10.4% | 7.0% |
| Interquartile 75% (IQ3) | 17.5% | 12.9% |
| Interquartile Range (IQR) | 7.1% | 5.9% |
| Standard Deviation (Sample) | 6.8% | 6.4% |
| Standard Deviation (Population) | 6.6% | 6.4% |
Similar Demographics by Male Poverty
Demographics Similar to Fijians by Male Poverty
In terms of male poverty, the demographic groups most similar to Fijians are Nicaraguan (12.6%, a difference of 0.050%), Immigrants from Armenia (12.6%, a difference of 0.060%), Salvadoran (12.6%, a difference of 0.16%), Immigrants from Laos (12.6%, a difference of 0.43%), and Immigrants from Saudi Arabia (12.7%, a difference of 0.68%).
| Demographics | Rating | Rank | Male Poverty |
| Nigerians | 1.4 /100 | #226 | Tragic 12.3% |
| Alaska Natives | 1.4 /100 | #227 | Tragic 12.4% |
| Alsatians | 1.3 /100 | #228 | Tragic 12.4% |
| Cubans | 1.3 /100 | #229 | Tragic 12.4% |
| Marshallese | 0.8 /100 | #230 | Tragic 12.5% |
| Salvadorans | 0.6 /100 | #231 | Tragic 12.6% |
| Nicaraguans | 0.6 /100 | #232 | Tragic 12.6% |
| Fijians | 0.6 /100 | #233 | Tragic 12.6% |
| Immigrants | Armenia | 0.6 /100 | #234 | Tragic 12.6% |
| Immigrants | Laos | 0.5 /100 | #235 | Tragic 12.6% |
| Immigrants | Saudi Arabia | 0.4 /100 | #236 | Tragic 12.7% |
| French American Indians | 0.4 /100 | #237 | Tragic 12.7% |
| Ecuadorians | 0.4 /100 | #238 | Tragic 12.7% |
| Ghanaians | 0.4 /100 | #239 | Tragic 12.7% |
| Immigrants | Middle Africa | 0.4 /100 | #240 | Tragic 12.7% |
Demographics Similar to Native Hawaiians by Male Poverty
In terms of male poverty, the demographic groups most similar to Native Hawaiians are Peruvian (10.7%, a difference of 0.020%), Immigrants from China (10.7%, a difference of 0.030%), South African (10.7%, a difference of 0.040%), French (10.7%, a difference of 0.070%), and Immigrants from Hungary (10.7%, a difference of 0.13%).
| Demographics | Rating | Rank | Male Poverty |
| Immigrants | Russia | 88.6 /100 | #115 | Excellent 10.6% |
| Sri Lankans | 88.1 /100 | #116 | Excellent 10.6% |
| Immigrants | South Eastern Asia | 88.1 /100 | #117 | Excellent 10.6% |
| Okinawans | 87.6 /100 | #118 | Excellent 10.7% |
| Immigrants | Hungary | 87.6 /100 | #119 | Excellent 10.7% |
| Immigrants | China | 87.1 /100 | #120 | Excellent 10.7% |
| Peruvians | 87.1 /100 | #121 | Excellent 10.7% |
| Native Hawaiians | 87.0 /100 | #122 | Excellent 10.7% |
| South Africans | 86.8 /100 | #123 | Excellent 10.7% |
| French | 86.7 /100 | #124 | Excellent 10.7% |
| Immigrants | Norway | 86.0 /100 | #125 | Excellent 10.7% |
| Immigrants | Ukraine | 84.3 /100 | #126 | Excellent 10.7% |
| Puget Sound Salish | 84.3 /100 | #127 | Excellent 10.7% |
| Immigrants | Western Europe | 84.2 /100 | #128 | Excellent 10.7% |
| Immigrants | Peru | 84.1 /100 | #129 | Excellent 10.7% |