Fijian vs Guyanese Single Mother Households
COMPARE
Fijian
Guyanese
Single Mother Households
Single Mother Households Comparison
Fijians
Guyanese
7.2%
SINGLE MOTHER HOUSEHOLDS
0.6/ 100
METRIC RATING
242nd/ 347
METRIC RANK
7.6%
SINGLE MOTHER HOUSEHOLDS
0.1/ 100
METRIC RATING
276th/ 347
METRIC RANK
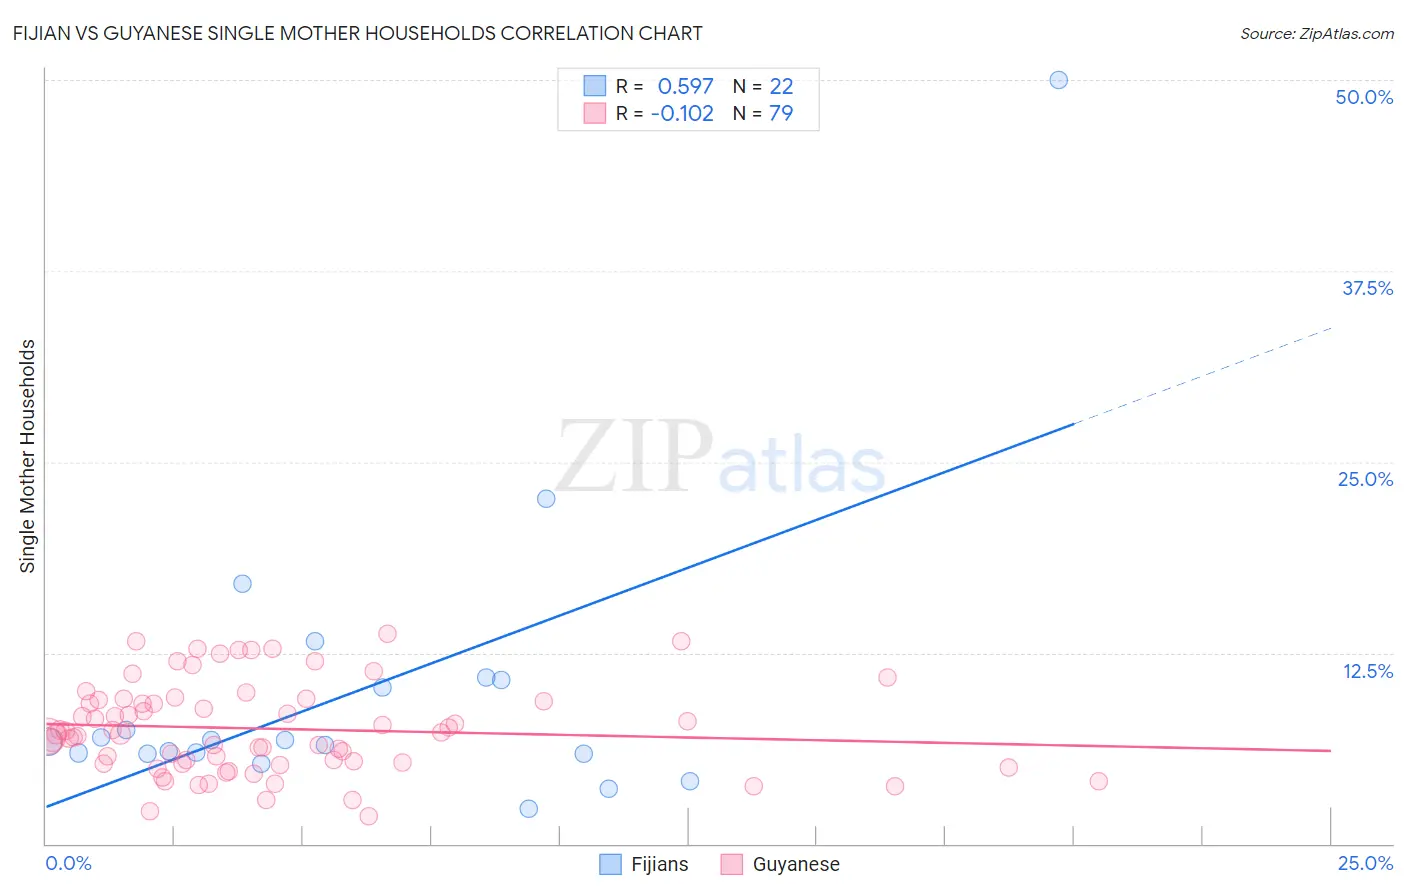
Fijian vs Guyanese Single Mother Households Correlation Chart
The statistical analysis conducted on geographies consisting of 55,926,537 people shows a substantial positive correlation between the proportion of Fijians and percentage of single mother households in the United States with a correlation coefficient (R) of 0.597 and weighted average of 7.2%. Similarly, the statistical analysis conducted on geographies consisting of 176,625,838 people shows a poor negative correlation between the proportion of Guyanese and percentage of single mother households in the United States with a correlation coefficient (R) of -0.102 and weighted average of 7.6%, a difference of 5.7%.
Single Mother Households Correlation Summary
| Measurement | Fijian | Guyanese |
| Minimum | 2.3% | 1.8% |
| Maximum | 50.0% | 13.7% |
| Range | 47.7% | 11.9% |
| Mean | 10.0% | 7.5% |
| Median | 6.7% | 7.2% |
| Interquartile 25% (IQ1) | 5.9% | 5.3% |
| Interquartile 75% (IQ3) | 10.7% | 9.4% |
| Interquartile Range (IQR) | 4.8% | 4.1% |
| Standard Deviation (Sample) | 10.0% | 2.9% |
| Standard Deviation (Population) | 9.8% | 2.9% |
Similar Demographics by Single Mother Households
Demographics Similar to Fijians by Single Mother Households
In terms of single mother households, the demographic groups most similar to Fijians are Ecuadorian (7.2%, a difference of 0.050%), Immigrants from Portugal (7.2%, a difference of 0.080%), Cuban (7.2%, a difference of 0.11%), Immigrants from Panama (7.2%, a difference of 0.43%), and Immigrants from Cambodia (7.2%, a difference of 0.46%).
| Demographics | Rating | Rank | Single Mother Households |
| Immigrants | Burma/Myanmar | 1.4 /100 | #235 | Tragic 7.0% |
| Ute | 1.0 /100 | #236 | Tragic 7.1% |
| Arapaho | 1.0 /100 | #237 | Tragic 7.1% |
| Panamanians | 0.9 /100 | #238 | Tragic 7.1% |
| Kiowa | 0.8 /100 | #239 | Tragic 7.1% |
| Immigrants | Panama | 0.7 /100 | #240 | Tragic 7.2% |
| Immigrants | Portugal | 0.6 /100 | #241 | Tragic 7.2% |
| Fijians | 0.6 /100 | #242 | Tragic 7.2% |
| Ecuadorians | 0.6 /100 | #243 | Tragic 7.2% |
| Cubans | 0.6 /100 | #244 | Tragic 7.2% |
| Immigrants | Cambodia | 0.5 /100 | #245 | Tragic 7.2% |
| Nicaraguans | 0.5 /100 | #246 | Tragic 7.2% |
| Dutch West Indians | 0.4 /100 | #247 | Tragic 7.3% |
| Spanish American Indians | 0.4 /100 | #248 | Tragic 7.3% |
| Bermudans | 0.4 /100 | #249 | Tragic 7.3% |
Demographics Similar to Guyanese by Single Mother Households
In terms of single mother households, the demographic groups most similar to Guyanese are Immigrants from Trinidad and Tobago (7.6%, a difference of 0.040%), Central American (7.6%, a difference of 0.050%), Immigrants from El Salvador (7.6%, a difference of 0.27%), Central American Indian (7.6%, a difference of 0.45%), and Immigrants from Guyana (7.6%, a difference of 0.55%).
| Demographics | Rating | Rank | Single Mother Households |
| Somalis | 0.1 /100 | #269 | Tragic 7.5% |
| Immigrants | Cuba | 0.1 /100 | #270 | Tragic 7.5% |
| Salvadorans | 0.1 /100 | #271 | Tragic 7.5% |
| Immigrants | Azores | 0.1 /100 | #272 | Tragic 7.5% |
| Belizeans | 0.1 /100 | #273 | Tragic 7.6% |
| Immigrants | Guyana | 0.1 /100 | #274 | Tragic 7.6% |
| Central American Indians | 0.1 /100 | #275 | Tragic 7.6% |
| Guyanese | 0.1 /100 | #276 | Tragic 7.6% |
| Immigrants | Trinidad and Tobago | 0.1 /100 | #277 | Tragic 7.6% |
| Central Americans | 0.1 /100 | #278 | Tragic 7.6% |
| Immigrants | El Salvador | 0.0 /100 | #279 | Tragic 7.6% |
| Immigrants | Sierra Leone | 0.0 /100 | #280 | Tragic 7.7% |
| Immigrants | Laos | 0.0 /100 | #281 | Tragic 7.7% |
| Guatemalans | 0.0 /100 | #282 | Tragic 7.7% |
| Nigerians | 0.0 /100 | #283 | Tragic 7.7% |