Fijian vs Immigrants from St. Vincent and the Grenadines Male Poverty
COMPARE
Fijian
Immigrants from St. Vincent and the Grenadines
Male Poverty
Male Poverty Comparison
Fijians
Immigrants from St. Vincent and the Grenadines
12.6%
MALE POVERTY
0.6/ 100
METRIC RATING
233rd/ 347
METRIC RANK
13.8%
MALE POVERTY
0.0/ 100
METRIC RATING
288th/ 347
METRIC RANK
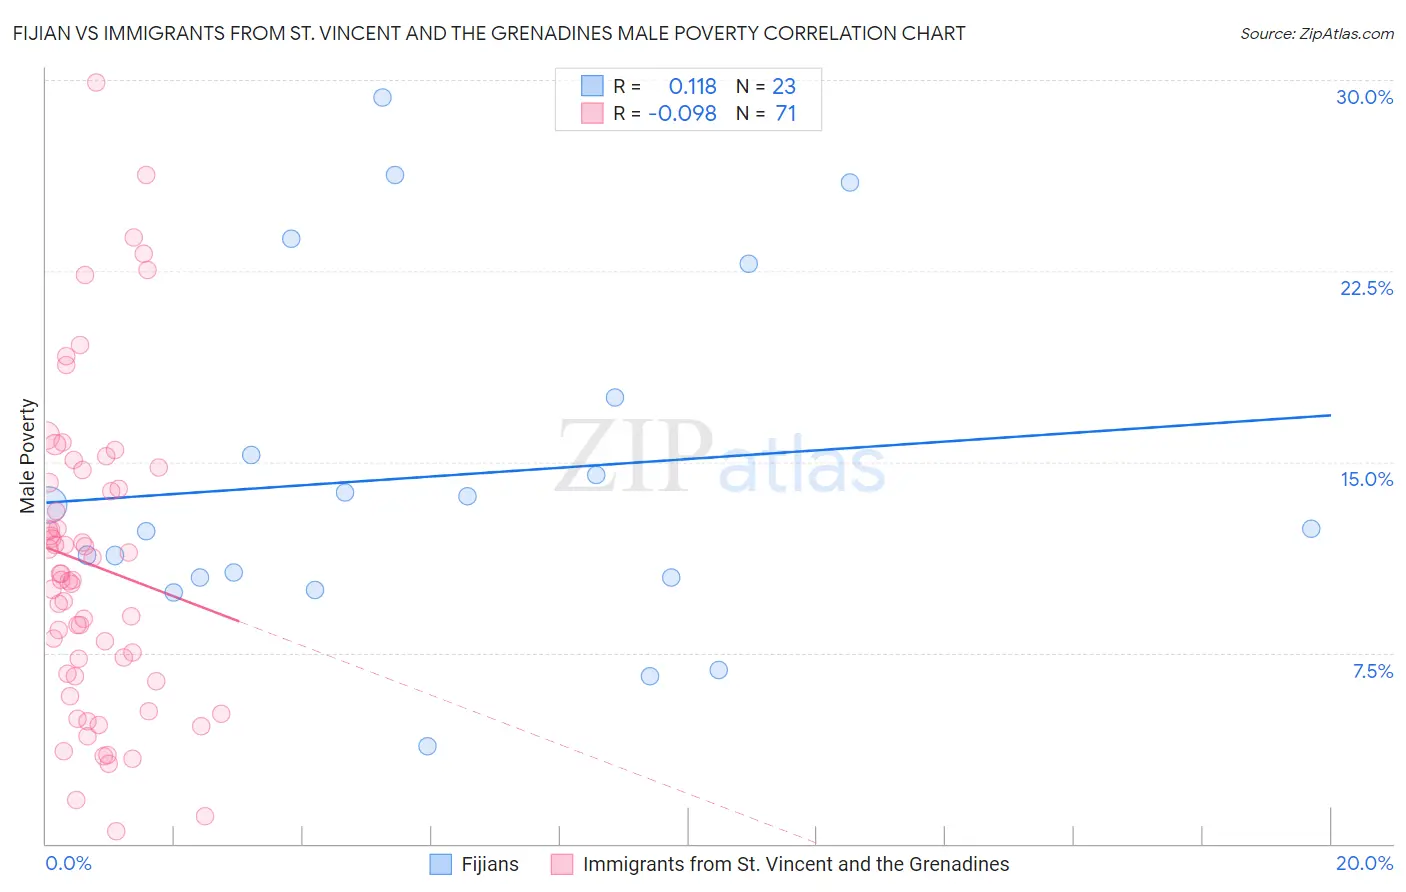
Fijian vs Immigrants from St. Vincent and the Grenadines Male Poverty Correlation Chart
The statistical analysis conducted on geographies consisting of 55,945,809 people shows a poor positive correlation between the proportion of Fijians and poverty level among males in the United States with a correlation coefficient (R) of 0.118 and weighted average of 12.6%. Similarly, the statistical analysis conducted on geographies consisting of 56,096,349 people shows a slight negative correlation between the proportion of Immigrants from St. Vincent and the Grenadines and poverty level among males in the United States with a correlation coefficient (R) of -0.098 and weighted average of 13.8%, a difference of 9.5%.
Male Poverty Correlation Summary
| Measurement | Fijian | Immigrants from St. Vincent and the Grenadines |
| Minimum | 3.8% | 0.49% |
| Maximum | 29.3% | 29.9% |
| Range | 25.4% | 29.4% |
| Mean | 14.4% | 11.0% |
| Median | 12.4% | 10.4% |
| Interquartile 25% (IQ1) | 10.4% | 6.6% |
| Interquartile 75% (IQ3) | 17.5% | 14.2% |
| Interquartile Range (IQR) | 7.1% | 7.6% |
| Standard Deviation (Sample) | 6.8% | 6.1% |
| Standard Deviation (Population) | 6.6% | 6.0% |
Similar Demographics by Male Poverty
Demographics Similar to Fijians by Male Poverty
In terms of male poverty, the demographic groups most similar to Fijians are Nicaraguan (12.6%, a difference of 0.050%), Immigrants from Armenia (12.6%, a difference of 0.060%), Salvadoran (12.6%, a difference of 0.16%), Immigrants from Laos (12.6%, a difference of 0.43%), and Immigrants from Saudi Arabia (12.7%, a difference of 0.68%).
| Demographics | Rating | Rank | Male Poverty |
| Nigerians | 1.4 /100 | #226 | Tragic 12.3% |
| Alaska Natives | 1.4 /100 | #227 | Tragic 12.4% |
| Alsatians | 1.3 /100 | #228 | Tragic 12.4% |
| Cubans | 1.3 /100 | #229 | Tragic 12.4% |
| Marshallese | 0.8 /100 | #230 | Tragic 12.5% |
| Salvadorans | 0.6 /100 | #231 | Tragic 12.6% |
| Nicaraguans | 0.6 /100 | #232 | Tragic 12.6% |
| Fijians | 0.6 /100 | #233 | Tragic 12.6% |
| Immigrants | Armenia | 0.6 /100 | #234 | Tragic 12.6% |
| Immigrants | Laos | 0.5 /100 | #235 | Tragic 12.6% |
| Immigrants | Saudi Arabia | 0.4 /100 | #236 | Tragic 12.7% |
| French American Indians | 0.4 /100 | #237 | Tragic 12.7% |
| Ecuadorians | 0.4 /100 | #238 | Tragic 12.7% |
| Ghanaians | 0.4 /100 | #239 | Tragic 12.7% |
| Immigrants | Middle Africa | 0.4 /100 | #240 | Tragic 12.7% |
Demographics Similar to Immigrants from St. Vincent and the Grenadines by Male Poverty
In terms of male poverty, the demographic groups most similar to Immigrants from St. Vincent and the Grenadines are Immigrants from Barbados (13.8%, a difference of 0.17%), Guatemalan (13.8%, a difference of 0.17%), Shoshone (13.8%, a difference of 0.18%), Immigrants from Zaire (13.8%, a difference of 0.18%), and West Indian (13.8%, a difference of 0.22%).
| Demographics | Rating | Rank | Male Poverty |
| Yaqui | 0.0 /100 | #281 | Tragic 13.7% |
| Immigrants | Cabo Verde | 0.0 /100 | #282 | Tragic 13.7% |
| Comanche | 0.0 /100 | #283 | Tragic 13.8% |
| Immigrants | Haiti | 0.0 /100 | #284 | Tragic 13.8% |
| West Indians | 0.0 /100 | #285 | Tragic 13.8% |
| Shoshone | 0.0 /100 | #286 | Tragic 13.8% |
| Immigrants | Barbados | 0.0 /100 | #287 | Tragic 13.8% |
| Immigrants | St. Vincent and the Grenadines | 0.0 /100 | #288 | Tragic 13.8% |
| Guatemalans | 0.0 /100 | #289 | Tragic 13.8% |
| Immigrants | Zaire | 0.0 /100 | #290 | Tragic 13.8% |
| Vietnamese | 0.0 /100 | #291 | Tragic 13.8% |
| Indonesians | 0.0 /100 | #292 | Tragic 13.8% |
| Immigrants | Belize | 0.0 /100 | #293 | Tragic 13.8% |
| Hispanics or Latinos | 0.0 /100 | #294 | Tragic 13.9% |
| Immigrants | Central America | 0.0 /100 | #295 | Tragic 13.9% |