Fijian vs Immigrants from Nicaragua Male Poverty
COMPARE
Fijian
Immigrants from Nicaragua
Male Poverty
Male Poverty Comparison
Fijians
Immigrants from Nicaragua
12.6%
MALE POVERTY
0.6/ 100
METRIC RATING
233rd/ 347
METRIC RANK
12.9%
MALE POVERTY
0.2/ 100
METRIC RATING
250th/ 347
METRIC RANK
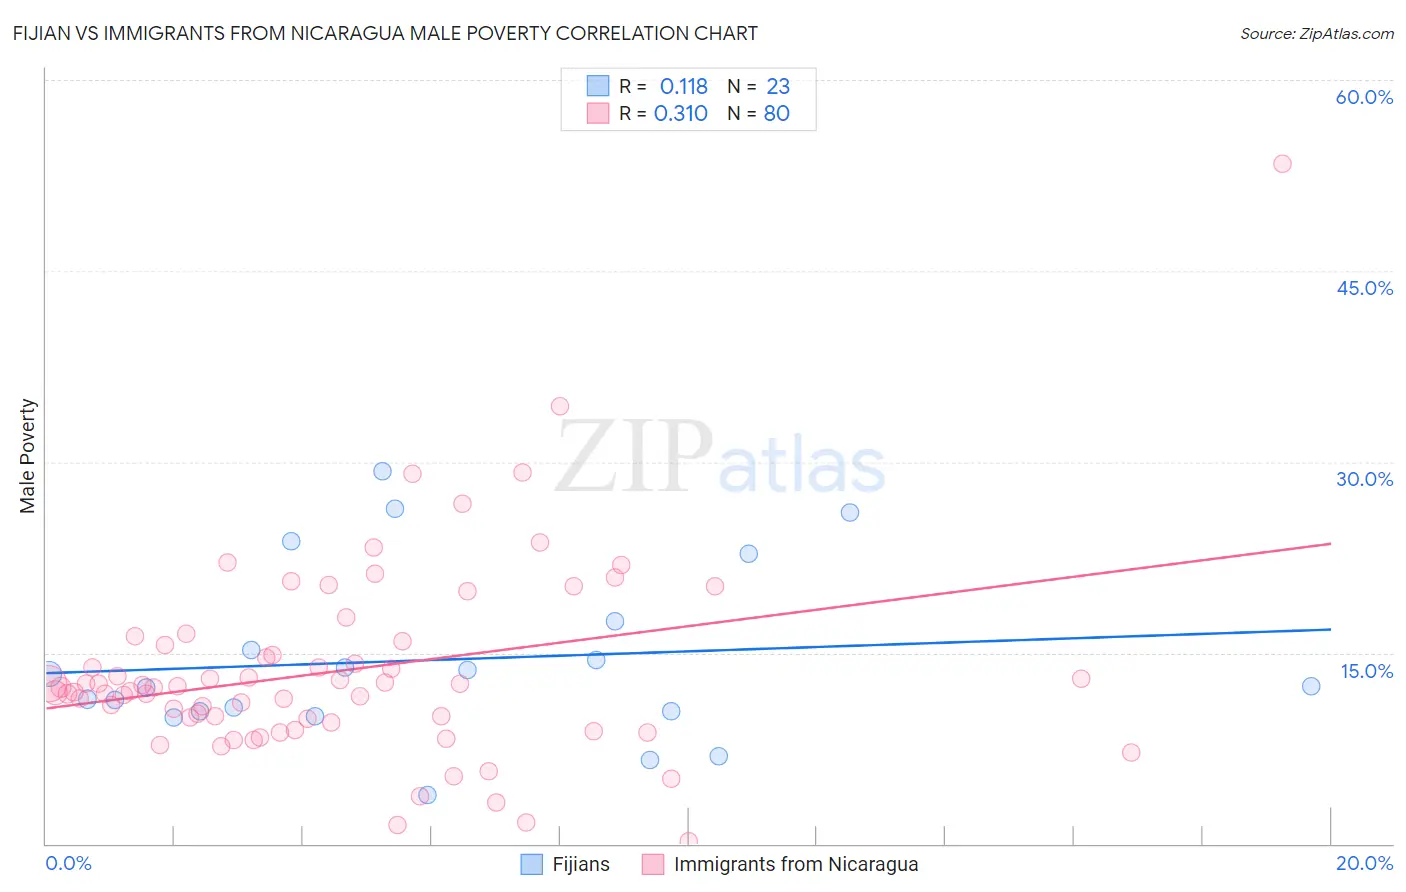
Fijian vs Immigrants from Nicaragua Male Poverty Correlation Chart
The statistical analysis conducted on geographies consisting of 55,945,809 people shows a poor positive correlation between the proportion of Fijians and poverty level among males in the United States with a correlation coefficient (R) of 0.118 and weighted average of 12.6%. Similarly, the statistical analysis conducted on geographies consisting of 236,310,825 people shows a mild positive correlation between the proportion of Immigrants from Nicaragua and poverty level among males in the United States with a correlation coefficient (R) of 0.310 and weighted average of 12.9%, a difference of 2.5%.
Male Poverty Correlation Summary
| Measurement | Fijian | Immigrants from Nicaragua |
| Minimum | 3.8% | 0.19% |
| Maximum | 29.3% | 53.4% |
| Range | 25.4% | 53.2% |
| Mean | 14.4% | 13.6% |
| Median | 12.4% | 12.3% |
| Interquartile 25% (IQ1) | 10.4% | 9.7% |
| Interquartile 75% (IQ3) | 17.5% | 15.8% |
| Interquartile Range (IQR) | 7.1% | 6.1% |
| Standard Deviation (Sample) | 6.8% | 7.7% |
| Standard Deviation (Population) | 6.6% | 7.7% |
Demographics Similar to Fijians and Immigrants from Nicaragua by Male Poverty
In terms of male poverty, the demographic groups most similar to Fijians are Nicaraguan (12.6%, a difference of 0.050%), Immigrants from Armenia (12.6%, a difference of 0.060%), Salvadoran (12.6%, a difference of 0.16%), Immigrants from Laos (12.6%, a difference of 0.43%), and Immigrants from Saudi Arabia (12.7%, a difference of 0.68%). Similarly, the demographic groups most similar to Immigrants from Nicaragua are Potawatomi (12.9%, a difference of 0.010%), Immigrants from Sudan (12.9%, a difference of 0.080%), Immigrants from Cuba (12.9%, a difference of 0.10%), Immigrants from Western Africa (12.9%, a difference of 0.14%), and Immigrants from El Salvador (12.8%, a difference of 0.49%).
| Demographics | Rating | Rank | Male Poverty |
| Salvadorans | 0.6 /100 | #231 | Tragic 12.6% |
| Nicaraguans | 0.6 /100 | #232 | Tragic 12.6% |
| Fijians | 0.6 /100 | #233 | Tragic 12.6% |
| Immigrants | Armenia | 0.6 /100 | #234 | Tragic 12.6% |
| Immigrants | Laos | 0.5 /100 | #235 | Tragic 12.6% |
| Immigrants | Saudi Arabia | 0.4 /100 | #236 | Tragic 12.7% |
| French American Indians | 0.4 /100 | #237 | Tragic 12.7% |
| Ecuadorians | 0.4 /100 | #238 | Tragic 12.7% |
| Ghanaians | 0.4 /100 | #239 | Tragic 12.7% |
| Immigrants | Middle Africa | 0.4 /100 | #240 | Tragic 12.7% |
| Sudanese | 0.3 /100 | #241 | Tragic 12.8% |
| Nepalese | 0.3 /100 | #242 | Tragic 12.8% |
| Alaskan Athabascans | 0.3 /100 | #243 | Tragic 12.8% |
| Tsimshian | 0.3 /100 | #244 | Tragic 12.8% |
| Liberians | 0.3 /100 | #245 | Tragic 12.8% |
| Immigrants | El Salvador | 0.2 /100 | #246 | Tragic 12.8% |
| Immigrants | Western Africa | 0.2 /100 | #247 | Tragic 12.9% |
| Immigrants | Sudan | 0.2 /100 | #248 | Tragic 12.9% |
| Potawatomi | 0.2 /100 | #249 | Tragic 12.9% |
| Immigrants | Nicaragua | 0.2 /100 | #250 | Tragic 12.9% |
| Immigrants | Cuba | 0.2 /100 | #251 | Tragic 12.9% |