Estonian vs Immigrants from Singapore Single Father Poverty
COMPARE
Estonian
Immigrants from Singapore
Single Father Poverty
Single Father Poverty Comparison
Estonians
Immigrants from Singapore
16.2%
SINGLE FATHER POVERTY
56.7/ 100
METRIC RATING
161st/ 347
METRIC RANK
14.3%
SINGLE FATHER POVERTY
100.0/ 100
METRIC RATING
20th/ 347
METRIC RANK
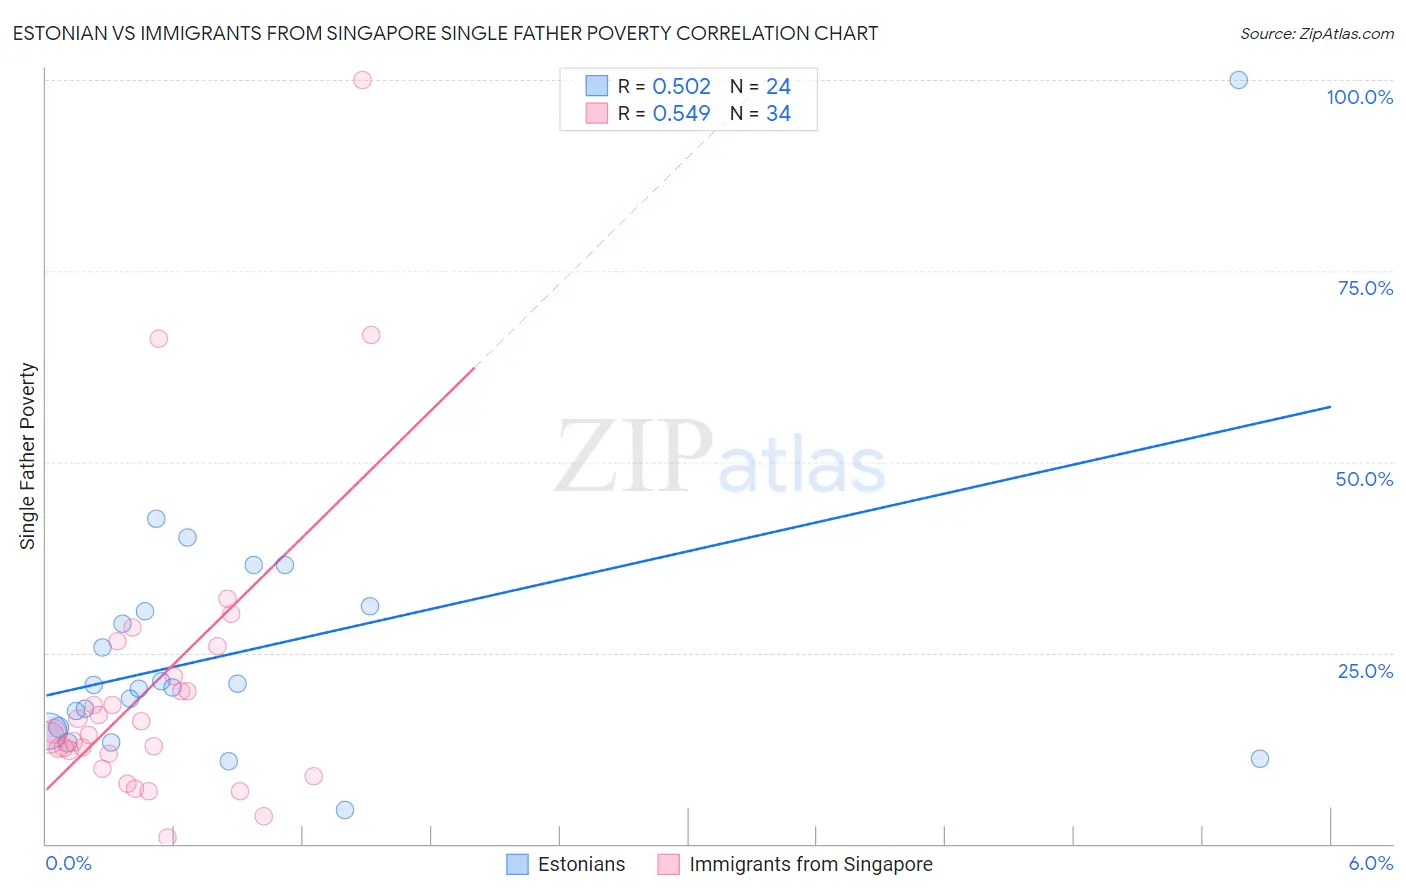
Estonian vs Immigrants from Singapore Single Father Poverty Correlation Chart
The statistical analysis conducted on geographies consisting of 107,284,896 people shows a substantial positive correlation between the proportion of Estonians and poverty level among single fathers in the United States with a correlation coefficient (R) of 0.502 and weighted average of 16.2%. Similarly, the statistical analysis conducted on geographies consisting of 118,546,936 people shows a substantial positive correlation between the proportion of Immigrants from Singapore and poverty level among single fathers in the United States with a correlation coefficient (R) of 0.549 and weighted average of 14.3%, a difference of 13.9%.
Single Father Poverty Correlation Summary
| Measurement | Estonian | Immigrants from Singapore |
| Minimum | 4.3% | 0.84% |
| Maximum | 100.0% | 100.0% |
| Range | 95.7% | 99.2% |
| Mean | 25.5% | 20.8% |
| Median | 20.6% | 14.5% |
| Interquartile 25% (IQ1) | 14.9% | 11.8% |
| Interquartile 75% (IQ3) | 30.7% | 21.9% |
| Interquartile Range (IQR) | 15.8% | 10.1% |
| Standard Deviation (Sample) | 18.7% | 19.9% |
| Standard Deviation (Population) | 18.3% | 19.6% |
Similar Demographics by Single Father Poverty
Demographics Similar to Estonians by Single Father Poverty
In terms of single father poverty, the demographic groups most similar to Estonians are Ugandan (16.3%, a difference of 0.040%), Immigrants from Costa Rica (16.3%, a difference of 0.040%), Guyanese (16.3%, a difference of 0.070%), Immigrants from Bangladesh (16.3%, a difference of 0.070%), and Immigrants from Europe (16.3%, a difference of 0.080%).
| Demographics | Rating | Rank | Single Father Poverty |
| Mexicans | 70.1 /100 | #154 | Good 16.1% |
| Immigrants | Nicaragua | 67.8 /100 | #155 | Good 16.2% |
| Immigrants | Jordan | 66.0 /100 | #156 | Good 16.2% |
| Immigrants | Czechoslovakia | 62.8 /100 | #157 | Good 16.2% |
| Portuguese | 62.3 /100 | #158 | Good 16.2% |
| Belizeans | 59.9 /100 | #159 | Average 16.2% |
| Immigrants | Sudan | 59.8 /100 | #160 | Average 16.2% |
| Estonians | 56.7 /100 | #161 | Average 16.2% |
| Ugandans | 55.9 /100 | #162 | Average 16.3% |
| Immigrants | Costa Rica | 55.7 /100 | #163 | Average 16.3% |
| Guyanese | 55.2 /100 | #164 | Average 16.3% |
| Immigrants | Bangladesh | 55.1 /100 | #165 | Average 16.3% |
| Immigrants | Europe | 54.8 /100 | #166 | Average 16.3% |
| Yugoslavians | 53.9 /100 | #167 | Average 16.3% |
| Costa Ricans | 53.6 /100 | #168 | Average 16.3% |
Demographics Similar to Immigrants from Singapore by Single Father Poverty
In terms of single father poverty, the demographic groups most similar to Immigrants from Singapore are Immigrants from Iraq (14.3%, a difference of 0.040%), Soviet Union (14.3%, a difference of 0.090%), Immigrants from Afghanistan (14.3%, a difference of 0.090%), Immigrants from Hong Kong (14.2%, a difference of 0.11%), and Taiwanese (14.3%, a difference of 0.43%).
| Demographics | Rating | Rank | Single Father Poverty |
| Immigrants | Philippines | 100.0 /100 | #13 | Exceptional 14.0% |
| Immigrants | Vietnam | 100.0 /100 | #14 | Exceptional 14.1% |
| Sri Lankans | 100.0 /100 | #15 | Exceptional 14.2% |
| Immigrants | Iran | 100.0 /100 | #16 | Exceptional 14.2% |
| Immigrants | Hong Kong | 100.0 /100 | #17 | Exceptional 14.2% |
| Soviet Union | 100.0 /100 | #18 | Exceptional 14.3% |
| Immigrants | Iraq | 100.0 /100 | #19 | Exceptional 14.3% |
| Immigrants | Singapore | 100.0 /100 | #20 | Exceptional 14.3% |
| Immigrants | Afghanistan | 100.0 /100 | #21 | Exceptional 14.3% |
| Taiwanese | 100.0 /100 | #22 | Exceptional 14.3% |
| Immigrants | Egypt | 100.0 /100 | #23 | Exceptional 14.4% |
| Immigrants | South Eastern Asia | 100.0 /100 | #24 | Exceptional 14.4% |
| Iranians | 100.0 /100 | #25 | Exceptional 14.4% |
| Spanish American Indians | 100.0 /100 | #26 | Exceptional 14.4% |
| Nepalese | 100.0 /100 | #27 | Exceptional 14.4% |