Estonian vs Immigrants from Pakistan Single Father Poverty
COMPARE
Estonian
Immigrants from Pakistan
Single Father Poverty
Single Father Poverty Comparison
Estonians
Immigrants from Pakistan
16.2%
SINGLE FATHER POVERTY
56.7/ 100
METRIC RATING
161st/ 347
METRIC RANK
15.0%
SINGLE FATHER POVERTY
99.9/ 100
METRIC RATING
51st/ 347
METRIC RANK
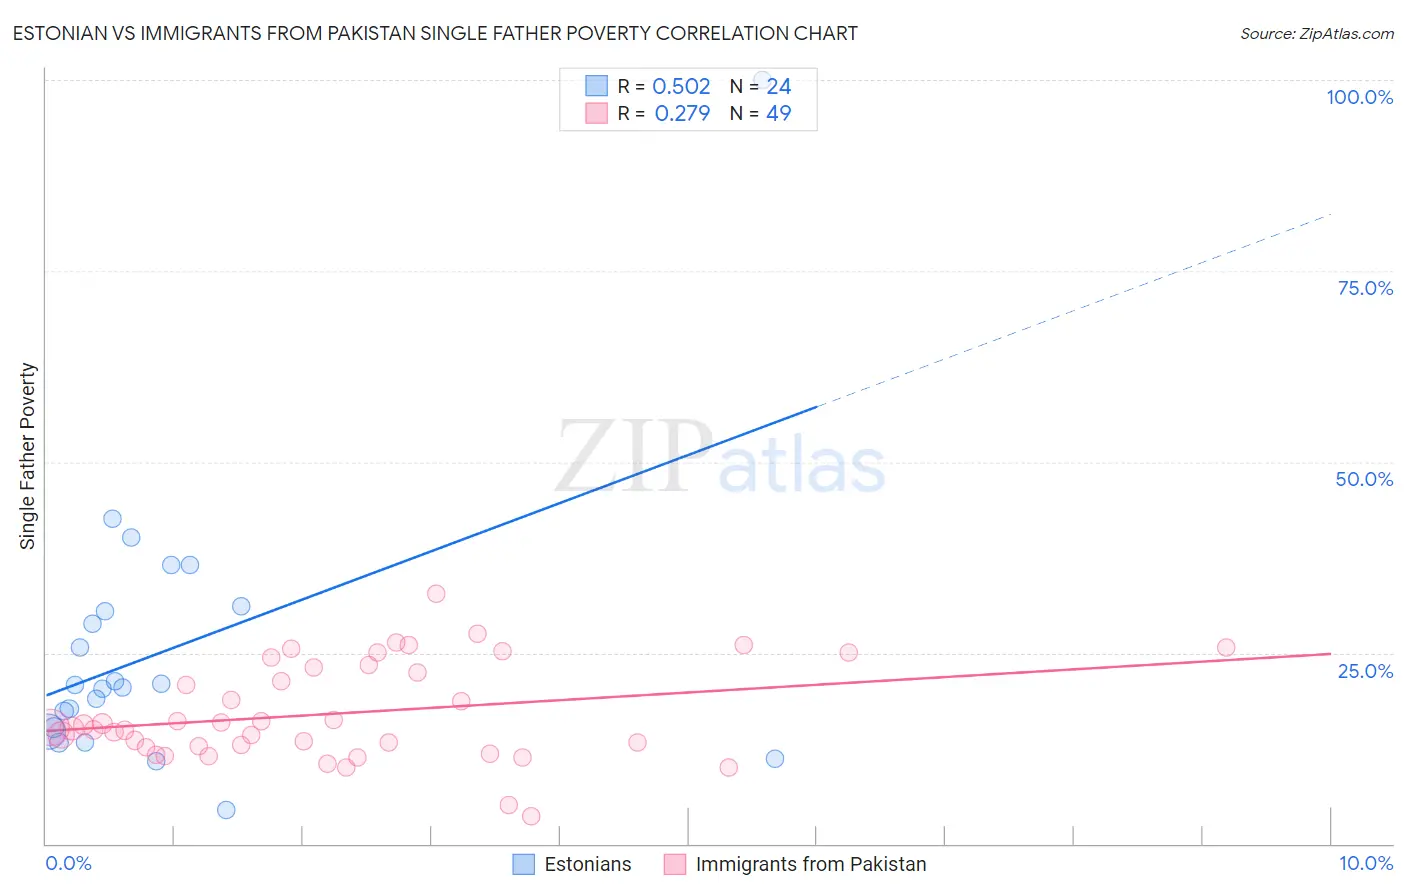
Estonian vs Immigrants from Pakistan Single Father Poverty Correlation Chart
The statistical analysis conducted on geographies consisting of 107,284,896 people shows a substantial positive correlation between the proportion of Estonians and poverty level among single fathers in the United States with a correlation coefficient (R) of 0.502 and weighted average of 16.2%. Similarly, the statistical analysis conducted on geographies consisting of 230,495,703 people shows a weak positive correlation between the proportion of Immigrants from Pakistan and poverty level among single fathers in the United States with a correlation coefficient (R) of 0.279 and weighted average of 15.0%, a difference of 8.5%.
Single Father Poverty Correlation Summary
| Measurement | Estonian | Immigrants from Pakistan |
| Minimum | 4.3% | 3.7% |
| Maximum | 100.0% | 32.8% |
| Range | 95.7% | 29.1% |
| Mean | 25.5% | 17.1% |
| Median | 20.6% | 15.2% |
| Interquartile 25% (IQ1) | 14.9% | 12.7% |
| Interquartile 75% (IQ3) | 30.7% | 23.2% |
| Interquartile Range (IQR) | 15.8% | 10.5% |
| Standard Deviation (Sample) | 18.7% | 6.4% |
| Standard Deviation (Population) | 18.3% | 6.3% |
Similar Demographics by Single Father Poverty
Demographics Similar to Estonians by Single Father Poverty
In terms of single father poverty, the demographic groups most similar to Estonians are Ugandan (16.3%, a difference of 0.040%), Immigrants from Costa Rica (16.3%, a difference of 0.040%), Guyanese (16.3%, a difference of 0.070%), Immigrants from Bangladesh (16.3%, a difference of 0.070%), and Immigrants from Europe (16.3%, a difference of 0.080%).
| Demographics | Rating | Rank | Single Father Poverty |
| Mexicans | 70.1 /100 | #154 | Good 16.1% |
| Immigrants | Nicaragua | 67.8 /100 | #155 | Good 16.2% |
| Immigrants | Jordan | 66.0 /100 | #156 | Good 16.2% |
| Immigrants | Czechoslovakia | 62.8 /100 | #157 | Good 16.2% |
| Portuguese | 62.3 /100 | #158 | Good 16.2% |
| Belizeans | 59.9 /100 | #159 | Average 16.2% |
| Immigrants | Sudan | 59.8 /100 | #160 | Average 16.2% |
| Estonians | 56.7 /100 | #161 | Average 16.2% |
| Ugandans | 55.9 /100 | #162 | Average 16.3% |
| Immigrants | Costa Rica | 55.7 /100 | #163 | Average 16.3% |
| Guyanese | 55.2 /100 | #164 | Average 16.3% |
| Immigrants | Bangladesh | 55.1 /100 | #165 | Average 16.3% |
| Immigrants | Europe | 54.8 /100 | #166 | Average 16.3% |
| Yugoslavians | 53.9 /100 | #167 | Average 16.3% |
| Costa Ricans | 53.6 /100 | #168 | Average 16.3% |
Demographics Similar to Immigrants from Pakistan by Single Father Poverty
In terms of single father poverty, the demographic groups most similar to Immigrants from Pakistan are Bhutanese (15.0%, a difference of 0.020%), Immigrants from El Salvador (15.0%, a difference of 0.040%), Immigrants from Eastern Asia (15.0%, a difference of 0.070%), Immigrants from Kenya (15.0%, a difference of 0.070%), and Immigrants from China (14.9%, a difference of 0.23%).
| Demographics | Rating | Rank | Single Father Poverty |
| Salvadorans | 100.0 /100 | #44 | Exceptional 14.9% |
| Immigrants | Somalia | 100.0 /100 | #45 | Exceptional 14.9% |
| Immigrants | Cambodia | 99.9 /100 | #46 | Exceptional 14.9% |
| Immigrants | China | 99.9 /100 | #47 | Exceptional 14.9% |
| Malaysians | 99.9 /100 | #48 | Exceptional 14.9% |
| Immigrants | Eastern Asia | 99.9 /100 | #49 | Exceptional 15.0% |
| Bhutanese | 99.9 /100 | #50 | Exceptional 15.0% |
| Immigrants | Pakistan | 99.9 /100 | #51 | Exceptional 15.0% |
| Immigrants | El Salvador | 99.9 /100 | #52 | Exceptional 15.0% |
| Immigrants | Kenya | 99.9 /100 | #53 | Exceptional 15.0% |
| Immigrants | Uzbekistan | 99.9 /100 | #54 | Exceptional 15.0% |
| Immigrants | Bulgaria | 99.9 /100 | #55 | Exceptional 15.0% |
| Immigrants | Laos | 99.9 /100 | #56 | Exceptional 15.1% |
| Laotians | 99.9 /100 | #57 | Exceptional 15.1% |
| Hawaiians | 99.9 /100 | #58 | Exceptional 15.1% |