Estonian vs Immigrants from Cameroon Single Father Poverty
COMPARE
Estonian
Immigrants from Cameroon
Single Father Poverty
Single Father Poverty Comparison
Estonians
Immigrants from Cameroon
16.2%
SINGLE FATHER POVERTY
56.7/ 100
METRIC RATING
161st/ 347
METRIC RANK
15.2%
SINGLE FATHER POVERTY
99.7/ 100
METRIC RATING
68th/ 347
METRIC RANK
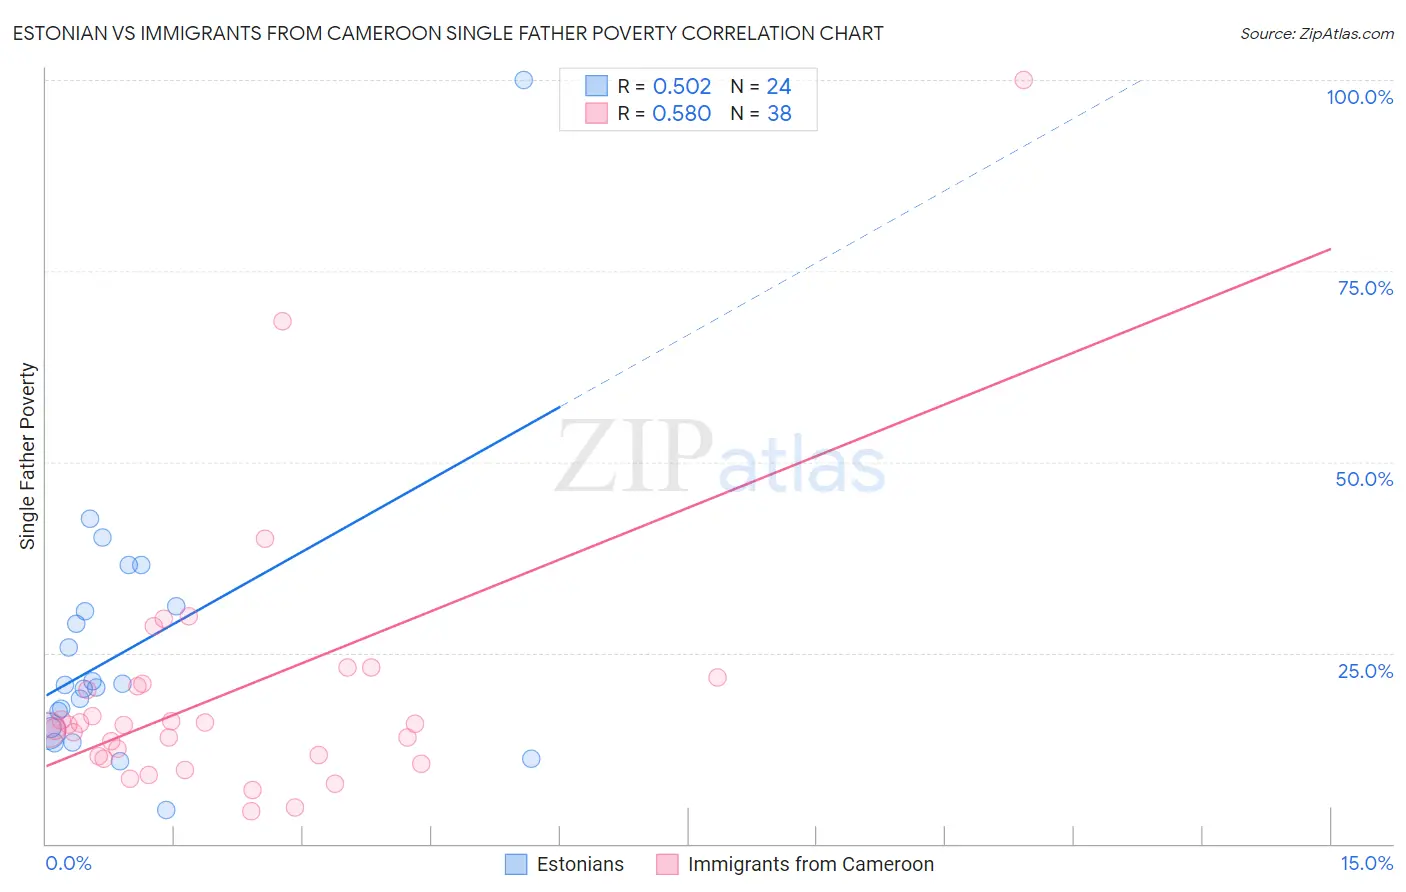
Estonian vs Immigrants from Cameroon Single Father Poverty Correlation Chart
The statistical analysis conducted on geographies consisting of 107,284,896 people shows a substantial positive correlation between the proportion of Estonians and poverty level among single fathers in the United States with a correlation coefficient (R) of 0.502 and weighted average of 16.2%. Similarly, the statistical analysis conducted on geographies consisting of 118,461,150 people shows a substantial positive correlation between the proportion of Immigrants from Cameroon and poverty level among single fathers in the United States with a correlation coefficient (R) of 0.580 and weighted average of 15.2%, a difference of 6.7%.
Single Father Poverty Correlation Summary
| Measurement | Estonian | Immigrants from Cameroon |
| Minimum | 4.3% | 4.2% |
| Maximum | 100.0% | 100.0% |
| Range | 95.7% | 95.8% |
| Mean | 25.5% | 19.7% |
| Median | 20.6% | 15.6% |
| Interquartile 25% (IQ1) | 14.9% | 11.5% |
| Interquartile 75% (IQ3) | 30.7% | 20.9% |
| Interquartile Range (IQR) | 15.8% | 9.4% |
| Standard Deviation (Sample) | 18.7% | 17.5% |
| Standard Deviation (Population) | 18.3% | 17.2% |
Similar Demographics by Single Father Poverty
Demographics Similar to Estonians by Single Father Poverty
In terms of single father poverty, the demographic groups most similar to Estonians are Ugandan (16.3%, a difference of 0.040%), Immigrants from Costa Rica (16.3%, a difference of 0.040%), Guyanese (16.3%, a difference of 0.070%), Immigrants from Bangladesh (16.3%, a difference of 0.070%), and Immigrants from Europe (16.3%, a difference of 0.080%).
| Demographics | Rating | Rank | Single Father Poverty |
| Mexicans | 70.1 /100 | #154 | Good 16.1% |
| Immigrants | Nicaragua | 67.8 /100 | #155 | Good 16.2% |
| Immigrants | Jordan | 66.0 /100 | #156 | Good 16.2% |
| Immigrants | Czechoslovakia | 62.8 /100 | #157 | Good 16.2% |
| Portuguese | 62.3 /100 | #158 | Good 16.2% |
| Belizeans | 59.9 /100 | #159 | Average 16.2% |
| Immigrants | Sudan | 59.8 /100 | #160 | Average 16.2% |
| Estonians | 56.7 /100 | #161 | Average 16.2% |
| Ugandans | 55.9 /100 | #162 | Average 16.3% |
| Immigrants | Costa Rica | 55.7 /100 | #163 | Average 16.3% |
| Guyanese | 55.2 /100 | #164 | Average 16.3% |
| Immigrants | Bangladesh | 55.1 /100 | #165 | Average 16.3% |
| Immigrants | Europe | 54.8 /100 | #166 | Average 16.3% |
| Yugoslavians | 53.9 /100 | #167 | Average 16.3% |
| Costa Ricans | 53.6 /100 | #168 | Average 16.3% |
Demographics Similar to Immigrants from Cameroon by Single Father Poverty
In terms of single father poverty, the demographic groups most similar to Immigrants from Cameroon are Japanese (15.2%, a difference of 0.030%), Paraguayan (15.2%, a difference of 0.090%), Mongolian (15.3%, a difference of 0.13%), Immigrants from Moldova (15.2%, a difference of 0.18%), and Immigrants from Malaysia (15.2%, a difference of 0.20%).
| Demographics | Rating | Rank | Single Father Poverty |
| Immigrants | Bosnia and Herzegovina | 99.8 /100 | #61 | Exceptional 15.2% |
| Immigrants | Armenia | 99.8 /100 | #62 | Exceptional 15.2% |
| Immigrants | Sweden | 99.8 /100 | #63 | Exceptional 15.2% |
| Bangladeshis | 99.8 /100 | #64 | Exceptional 15.2% |
| Immigrants | Malaysia | 99.8 /100 | #65 | Exceptional 15.2% |
| Immigrants | Moldova | 99.8 /100 | #66 | Exceptional 15.2% |
| Paraguayans | 99.7 /100 | #67 | Exceptional 15.2% |
| Immigrants | Cameroon | 99.7 /100 | #68 | Exceptional 15.2% |
| Japanese | 99.7 /100 | #69 | Exceptional 15.2% |
| Mongolians | 99.7 /100 | #70 | Exceptional 15.3% |
| Immigrants | Brazil | 99.6 /100 | #71 | Exceptional 15.3% |
| Immigrants | Lithuania | 99.6 /100 | #72 | Exceptional 15.3% |
| Kenyans | 99.6 /100 | #73 | Exceptional 15.3% |
| Maltese | 99.6 /100 | #74 | Exceptional 15.3% |
| Immigrants | Turkey | 99.5 /100 | #75 | Exceptional 15.3% |