Creek vs Serbian Single Female Poverty
COMPARE
Creek
Serbian
Single Female Poverty
Single Female Poverty Comparison
Creek
Serbians
27.4%
SINGLE FEMALE POVERTY
0.0/ 100
METRIC RATING
326th/ 347
METRIC RANK
20.1%
SINGLE FEMALE POVERTY
93.3/ 100
METRIC RATING
126th/ 347
METRIC RANK
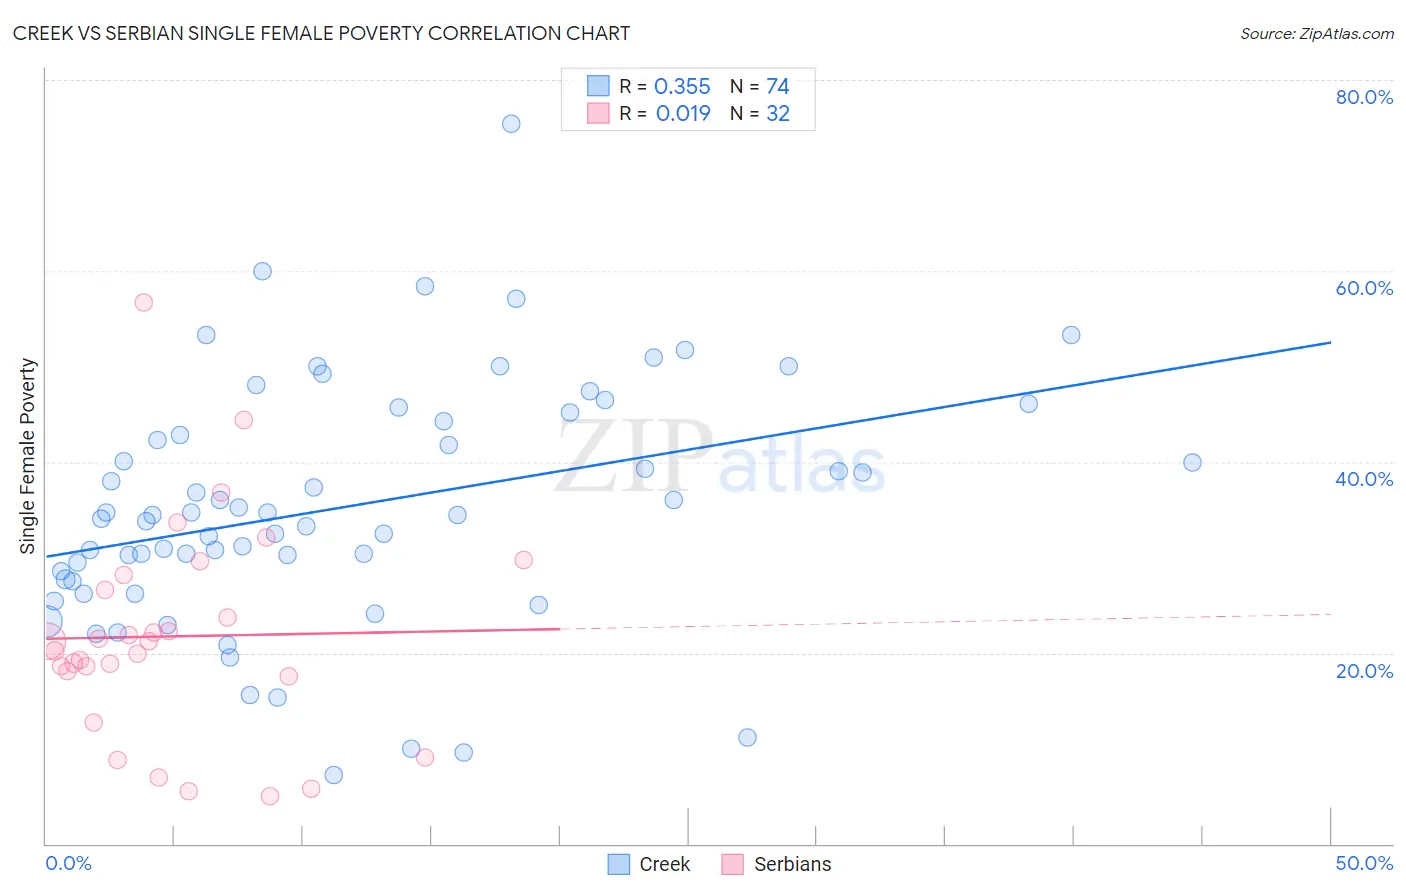
Creek vs Serbian Single Female Poverty Correlation Chart
The statistical analysis conducted on geographies consisting of 177,486,676 people shows a mild positive correlation between the proportion of Creek and poverty level among single females in the United States with a correlation coefficient (R) of 0.355 and weighted average of 27.4%. Similarly, the statistical analysis conducted on geographies consisting of 264,350,230 people shows no correlation between the proportion of Serbians and poverty level among single females in the United States with a correlation coefficient (R) of 0.019 and weighted average of 20.1%, a difference of 36.2%.
Single Female Poverty Correlation Summary
| Measurement | Creek | Serbian |
| Minimum | 7.1% | 5.0% |
| Maximum | 75.4% | 56.7% |
| Range | 68.3% | 51.7% |
| Mean | 35.3% | 21.7% |
| Median | 34.4% | 20.7% |
| Interquartile 25% (IQ1) | 27.7% | 17.8% |
| Interquartile 75% (IQ3) | 44.3% | 27.4% |
| Interquartile Range (IQR) | 16.6% | 9.6% |
| Standard Deviation (Sample) | 12.7% | 11.2% |
| Standard Deviation (Population) | 12.6% | 11.1% |
Similar Demographics by Single Female Poverty
Demographics Similar to Creek by Single Female Poverty
In terms of single female poverty, the demographic groups most similar to Creek are Dutch West Indian (27.5%, a difference of 0.080%), Choctaw (27.2%, a difference of 0.88%), Apache (27.7%, a difference of 0.99%), Menominee (27.8%, a difference of 1.5%), and Kiowa (26.9%, a difference of 1.9%).
| Demographics | Rating | Rank | Single Female Poverty |
| Blacks/African Americans | 0.0 /100 | #319 | Tragic 26.4% |
| Arapaho | 0.0 /100 | #320 | Tragic 26.4% |
| Yup'ik | 0.0 /100 | #321 | Tragic 26.6% |
| Seminole | 0.0 /100 | #322 | Tragic 26.8% |
| Chippewa | 0.0 /100 | #323 | Tragic 26.8% |
| Kiowa | 0.0 /100 | #324 | Tragic 26.9% |
| Choctaw | 0.0 /100 | #325 | Tragic 27.2% |
| Creek | 0.0 /100 | #326 | Tragic 27.4% |
| Dutch West Indians | 0.0 /100 | #327 | Tragic 27.5% |
| Apache | 0.0 /100 | #328 | Tragic 27.7% |
| Menominee | 0.0 /100 | #329 | Tragic 27.8% |
| Hopi | 0.0 /100 | #330 | Tragic 28.0% |
| Natives/Alaskans | 0.0 /100 | #331 | Tragic 28.2% |
| Yakama | 0.0 /100 | #332 | Tragic 28.3% |
| Ute | 0.0 /100 | #333 | Tragic 28.4% |
Demographics Similar to Serbians by Single Female Poverty
In terms of single female poverty, the demographic groups most similar to Serbians are Mongolian (20.2%, a difference of 0.020%), Immigrants from Spain (20.2%, a difference of 0.13%), Immigrants from South Africa (20.1%, a difference of 0.17%), Immigrants from Morocco (20.2%, a difference of 0.21%), and Immigrants from Hungary (20.2%, a difference of 0.23%).
| Demographics | Rating | Rank | Single Female Poverty |
| Immigrants | Ethiopia | 95.4 /100 | #119 | Exceptional 20.0% |
| South Americans | 95.1 /100 | #120 | Exceptional 20.0% |
| Immigrants | Switzerland | 95.1 /100 | #121 | Exceptional 20.0% |
| Immigrants | South America | 95.0 /100 | #122 | Exceptional 20.0% |
| Brazilians | 94.4 /100 | #123 | Exceptional 20.1% |
| Immigrants | Chile | 94.3 /100 | #124 | Exceptional 20.1% |
| Immigrants | South Africa | 93.9 /100 | #125 | Exceptional 20.1% |
| Serbians | 93.3 /100 | #126 | Exceptional 20.1% |
| Mongolians | 93.2 /100 | #127 | Exceptional 20.2% |
| Immigrants | Spain | 92.7 /100 | #128 | Exceptional 20.2% |
| Immigrants | Morocco | 92.4 /100 | #129 | Exceptional 20.2% |
| Immigrants | Hungary | 92.3 /100 | #130 | Exceptional 20.2% |
| Pakistanis | 92.1 /100 | #131 | Exceptional 20.2% |
| Uruguayans | 92.1 /100 | #132 | Exceptional 20.2% |
| Immigrants | England | 91.9 /100 | #133 | Exceptional 20.2% |