British vs Russian Single Female Poverty
COMPARE
British
Russian
Single Female Poverty
Single Female Poverty Comparison
British
Russians
21.1%
SINGLE FEMALE POVERTY
42.9/ 100
METRIC RATING
179th/ 347
METRIC RANK
19.2%
SINGLE FEMALE POVERTY
99.6/ 100
METRIC RATING
60th/ 347
METRIC RANK
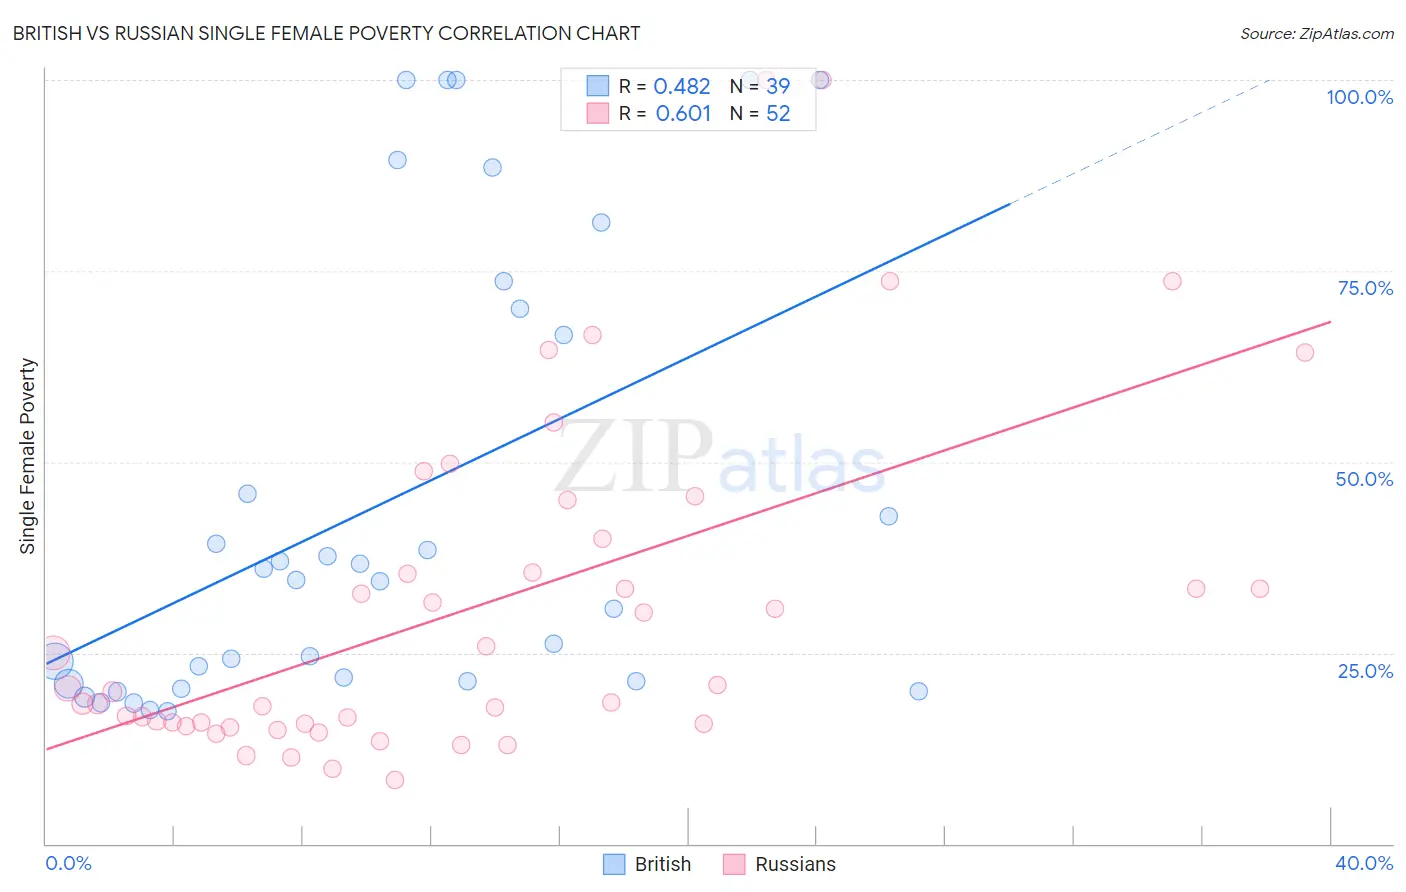
British vs Russian Single Female Poverty Correlation Chart
The statistical analysis conducted on geographies consisting of 516,545,848 people shows a moderate positive correlation between the proportion of British and poverty level among single females in the United States with a correlation coefficient (R) of 0.482 and weighted average of 21.1%. Similarly, the statistical analysis conducted on geographies consisting of 497,545,833 people shows a significant positive correlation between the proportion of Russians and poverty level among single females in the United States with a correlation coefficient (R) of 0.601 and weighted average of 19.2%, a difference of 10.0%.
Single Female Poverty Correlation Summary
| Measurement | British | Russian |
| Minimum | 17.3% | 8.3% |
| Maximum | 100.0% | 100.0% |
| Range | 82.7% | 91.7% |
| Mean | 44.7% | 31.0% |
| Median | 34.5% | 20.1% |
| Interquartile 25% (IQ1) | 21.2% | 15.7% |
| Interquartile 75% (IQ3) | 70.0% | 37.8% |
| Interquartile Range (IQR) | 48.8% | 22.1% |
| Standard Deviation (Sample) | 29.4% | 22.3% |
| Standard Deviation (Population) | 29.0% | 22.1% |
Similar Demographics by Single Female Poverty
Demographics Similar to British by Single Female Poverty
In terms of single female poverty, the demographic groups most similar to British are Spanish American Indian (21.1%, a difference of 0.030%), European (21.1%, a difference of 0.040%), Immigrants from Bosnia and Herzegovina (21.1%, a difference of 0.12%), Scandinavian (21.1%, a difference of 0.14%), and Slavic (21.1%, a difference of 0.15%).
| Demographics | Rating | Rank | Single Female Poverty |
| Guyanese | 52.0 /100 | #172 | Average 21.0% |
| Immigrants | Guyana | 50.6 /100 | #173 | Average 21.0% |
| Cubans | 50.0 /100 | #174 | Average 21.0% |
| Czechs | 46.8 /100 | #175 | Average 21.0% |
| Canadians | 45.4 /100 | #176 | Average 21.1% |
| Scandinavians | 45.2 /100 | #177 | Average 21.1% |
| Immigrants | Bosnia and Herzegovina | 44.9 /100 | #178 | Average 21.1% |
| British | 42.9 /100 | #179 | Average 21.1% |
| Spanish American Indians | 42.5 /100 | #180 | Average 21.1% |
| Europeans | 42.3 /100 | #181 | Average 21.1% |
| Slavs | 40.5 /100 | #182 | Average 21.1% |
| Slovaks | 39.7 /100 | #183 | Fair 21.1% |
| Hungarians | 39.6 /100 | #184 | Fair 21.1% |
| Immigrants | Cambodia | 38.2 /100 | #185 | Fair 21.2% |
| Hawaiians | 37.7 /100 | #186 | Fair 21.2% |
Demographics Similar to Russians by Single Female Poverty
In terms of single female poverty, the demographic groups most similar to Russians are Cambodian (19.2%, a difference of 0.020%), Lithuanian (19.2%, a difference of 0.070%), Sri Lankan (19.2%, a difference of 0.10%), Immigrants from Northern Europe (19.2%, a difference of 0.19%), and Immigrants from Bulgaria (19.1%, a difference of 0.20%).
| Demographics | Rating | Rank | Single Female Poverty |
| Tsimshian | 99.7 /100 | #53 | Exceptional 19.1% |
| Argentineans | 99.7 /100 | #54 | Exceptional 19.1% |
| Immigrants | Vietnam | 99.7 /100 | #55 | Exceptional 19.1% |
| Immigrants | Fiji | 99.7 /100 | #56 | Exceptional 19.1% |
| Eastern Europeans | 99.7 /100 | #57 | Exceptional 19.1% |
| Immigrants | Bulgaria | 99.7 /100 | #58 | Exceptional 19.1% |
| Sri Lankans | 99.6 /100 | #59 | Exceptional 19.2% |
| Russians | 99.6 /100 | #60 | Exceptional 19.2% |
| Cambodians | 99.6 /100 | #61 | Exceptional 19.2% |
| Lithuanians | 99.6 /100 | #62 | Exceptional 19.2% |
| Immigrants | Northern Europe | 99.6 /100 | #63 | Exceptional 19.2% |
| Immigrants | Europe | 99.6 /100 | #64 | Exceptional 19.2% |
| Cypriots | 99.6 /100 | #65 | Exceptional 19.2% |
| Palestinians | 99.6 /100 | #66 | Exceptional 19.2% |
| Immigrants | Egypt | 99.6 /100 | #67 | Exceptional 19.2% |