Immigrants from Honduras vs Russian Single Female Poverty
COMPARE
Immigrants from Honduras
Russian
Single Female Poverty
Single Female Poverty Comparison
Immigrants from Honduras
Russians
25.5%
SINGLE FEMALE POVERTY
0.0/ 100
METRIC RATING
311th/ 347
METRIC RANK
19.2%
SINGLE FEMALE POVERTY
99.6/ 100
METRIC RATING
60th/ 347
METRIC RANK
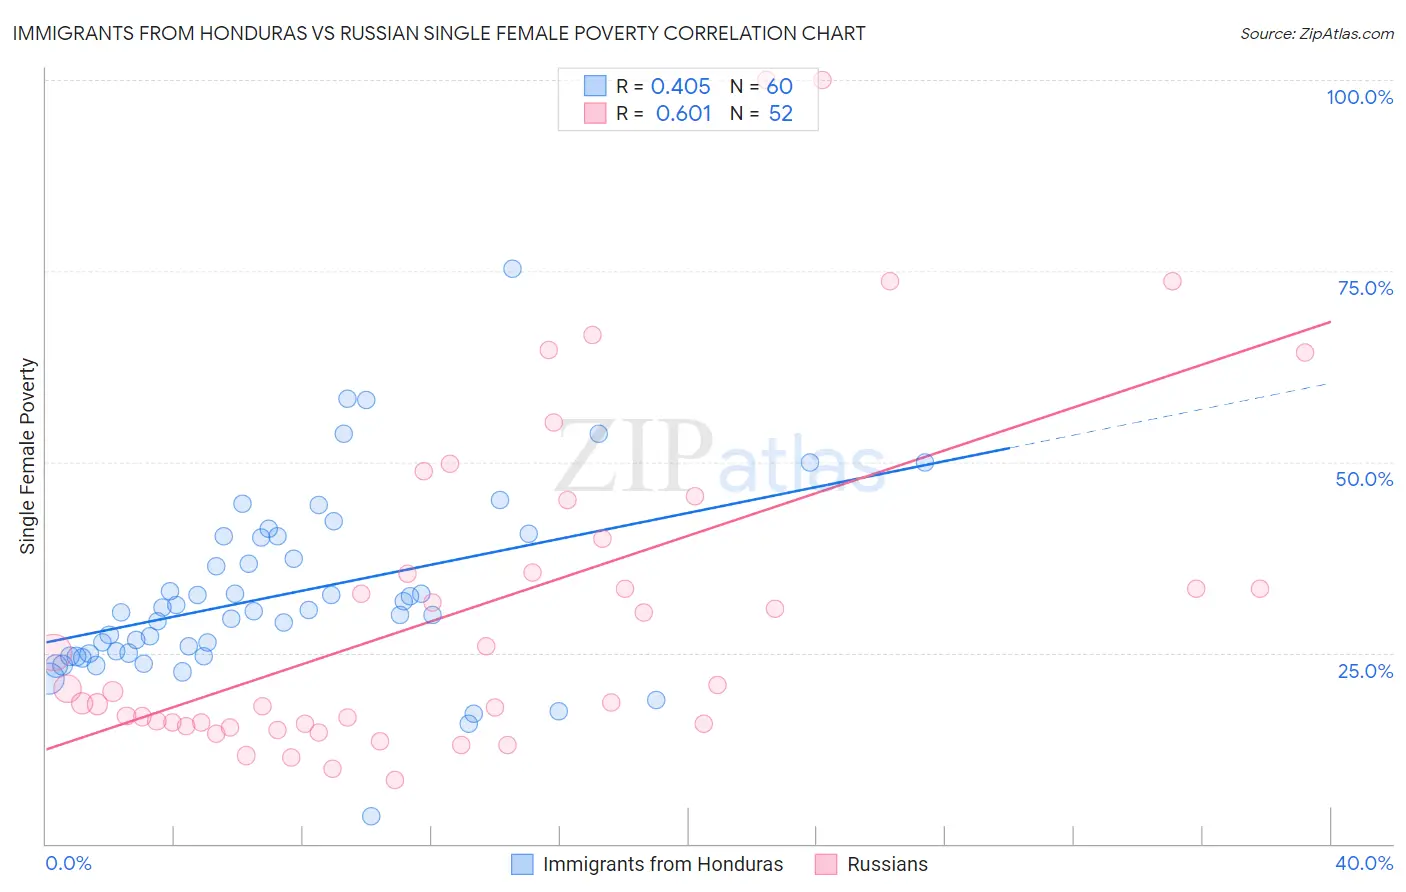
Immigrants from Honduras vs Russian Single Female Poverty Correlation Chart
The statistical analysis conducted on geographies consisting of 320,392,656 people shows a moderate positive correlation between the proportion of Immigrants from Honduras and poverty level among single females in the United States with a correlation coefficient (R) of 0.405 and weighted average of 25.5%. Similarly, the statistical analysis conducted on geographies consisting of 497,545,833 people shows a significant positive correlation between the proportion of Russians and poverty level among single females in the United States with a correlation coefficient (R) of 0.601 and weighted average of 19.2%, a difference of 33.0%.
Single Female Poverty Correlation Summary
| Measurement | Immigrants from Honduras | Russian |
| Minimum | 3.6% | 8.3% |
| Maximum | 75.2% | 100.0% |
| Range | 71.6% | 91.7% |
| Mean | 32.7% | 31.0% |
| Median | 30.4% | 20.1% |
| Interquartile 25% (IQ1) | 24.7% | 15.7% |
| Interquartile 75% (IQ3) | 40.2% | 37.8% |
| Interquartile Range (IQR) | 15.4% | 22.1% |
| Standard Deviation (Sample) | 12.1% | 22.3% |
| Standard Deviation (Population) | 12.0% | 22.1% |
Similar Demographics by Single Female Poverty
Demographics Similar to Immigrants from Honduras by Single Female Poverty
In terms of single female poverty, the demographic groups most similar to Immigrants from Honduras are Paiute (25.5%, a difference of 0.050%), Comanche (25.6%, a difference of 0.16%), Central American Indian (25.5%, a difference of 0.28%), Dominican (25.4%, a difference of 0.43%), and Aleut (25.4%, a difference of 0.44%).
| Demographics | Rating | Rank | Single Female Poverty |
| Immigrants | Congo | 0.0 /100 | #304 | Tragic 25.3% |
| Immigrants | Dominican Republic | 0.0 /100 | #305 | Tragic 25.3% |
| Immigrants | Mexico | 0.0 /100 | #306 | Tragic 25.3% |
| Potawatomi | 0.0 /100 | #307 | Tragic 25.4% |
| Aleuts | 0.0 /100 | #308 | Tragic 25.4% |
| Dominicans | 0.0 /100 | #309 | Tragic 25.4% |
| Central American Indians | 0.0 /100 | #310 | Tragic 25.5% |
| Immigrants | Honduras | 0.0 /100 | #311 | Tragic 25.5% |
| Paiute | 0.0 /100 | #312 | Tragic 25.5% |
| Comanche | 0.0 /100 | #313 | Tragic 25.6% |
| Cherokee | 0.0 /100 | #314 | Tragic 25.7% |
| Iroquois | 0.0 /100 | #315 | Tragic 25.7% |
| Immigrants | Somalia | 0.0 /100 | #316 | Tragic 25.8% |
| Ottawa | 0.0 /100 | #317 | Tragic 26.0% |
| Chickasaw | 0.0 /100 | #318 | Tragic 26.3% |
Demographics Similar to Russians by Single Female Poverty
In terms of single female poverty, the demographic groups most similar to Russians are Cambodian (19.2%, a difference of 0.020%), Lithuanian (19.2%, a difference of 0.070%), Sri Lankan (19.2%, a difference of 0.10%), Immigrants from Northern Europe (19.2%, a difference of 0.19%), and Immigrants from Bulgaria (19.1%, a difference of 0.20%).
| Demographics | Rating | Rank | Single Female Poverty |
| Tsimshian | 99.7 /100 | #53 | Exceptional 19.1% |
| Argentineans | 99.7 /100 | #54 | Exceptional 19.1% |
| Immigrants | Vietnam | 99.7 /100 | #55 | Exceptional 19.1% |
| Immigrants | Fiji | 99.7 /100 | #56 | Exceptional 19.1% |
| Eastern Europeans | 99.7 /100 | #57 | Exceptional 19.1% |
| Immigrants | Bulgaria | 99.7 /100 | #58 | Exceptional 19.1% |
| Sri Lankans | 99.6 /100 | #59 | Exceptional 19.2% |
| Russians | 99.6 /100 | #60 | Exceptional 19.2% |
| Cambodians | 99.6 /100 | #61 | Exceptional 19.2% |
| Lithuanians | 99.6 /100 | #62 | Exceptional 19.2% |
| Immigrants | Northern Europe | 99.6 /100 | #63 | Exceptional 19.2% |
| Immigrants | Europe | 99.6 /100 | #64 | Exceptional 19.2% |
| Cypriots | 99.6 /100 | #65 | Exceptional 19.2% |
| Palestinians | 99.6 /100 | #66 | Exceptional 19.2% |
| Immigrants | Egypt | 99.6 /100 | #67 | Exceptional 19.2% |