Dominican vs Lebanese Householder Income Ages 45 - 64 years
COMPARE
Dominican
Lebanese
Householder Income Ages 45 - 64 years
Householder Income Ages 45 - 64 years Comparison
Dominicans
Lebanese
$80,623
HOUSEHOLDER INCOME AGES 45 - 64 YEARS
0.0/ 100
METRIC RATING
326th/ 347
METRIC RANK
$104,734
HOUSEHOLDER INCOME AGES 45 - 64 YEARS
90.1/ 100
METRIC RATING
132nd/ 347
METRIC RANK
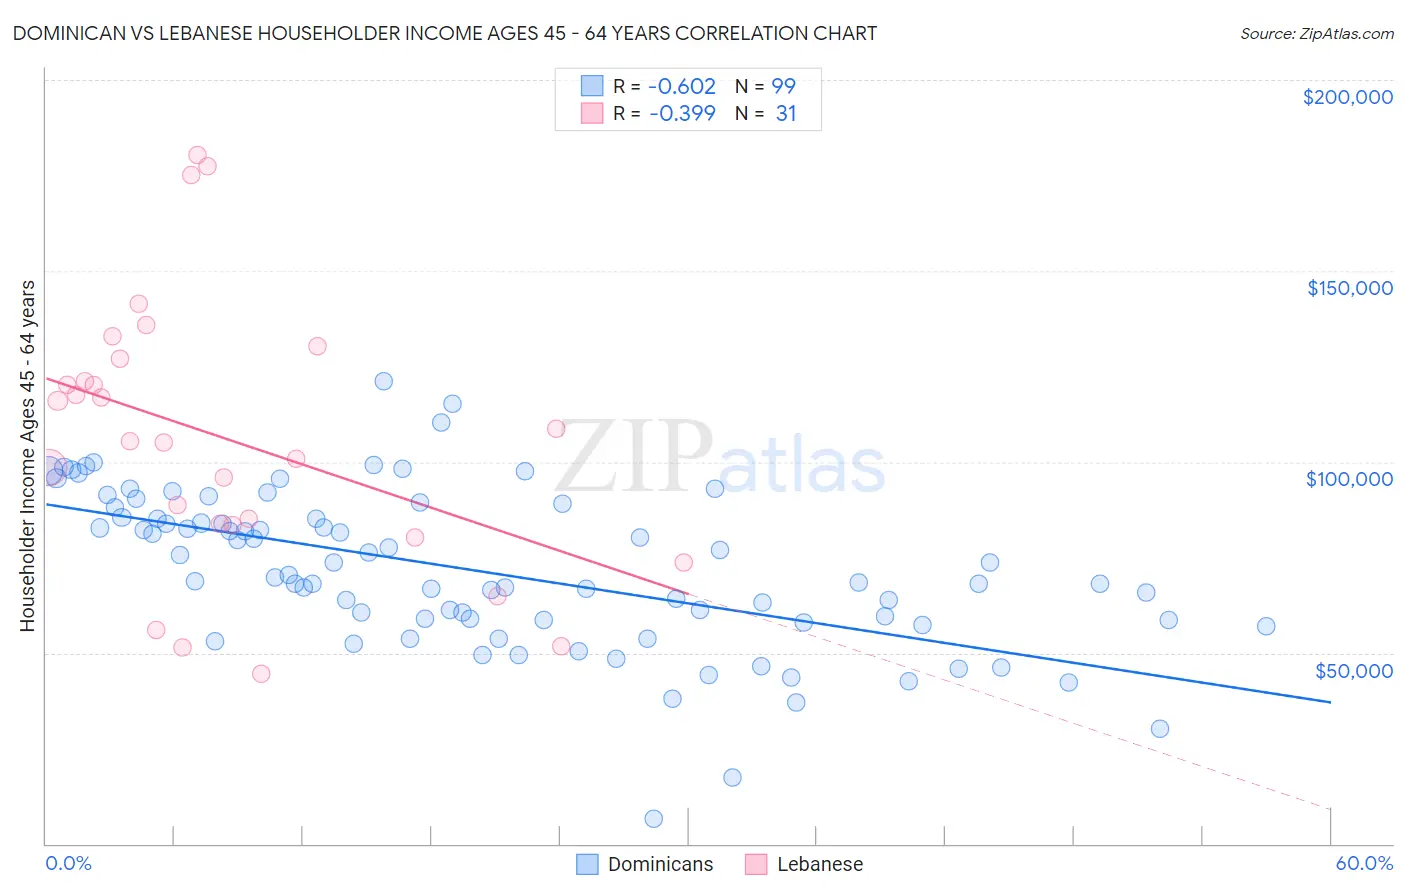
Dominican vs Lebanese Householder Income Ages 45 - 64 years Correlation Chart
The statistical analysis conducted on geographies consisting of 354,285,303 people shows a significant negative correlation between the proportion of Dominicans and household income with householder between the ages 45 and 64 in the United States with a correlation coefficient (R) of -0.602 and weighted average of $80,623. Similarly, the statistical analysis conducted on geographies consisting of 400,891,576 people shows a mild negative correlation between the proportion of Lebanese and household income with householder between the ages 45 and 64 in the United States with a correlation coefficient (R) of -0.399 and weighted average of $104,734, a difference of 29.9%.
Householder Income Ages 45 - 64 years Correlation Summary
| Measurement | Dominican | Lebanese |
| Minimum | $6,600 | $44,583 |
| Maximum | $121,165 | $180,429 |
| Range | $114,565 | $135,846 |
| Mean | $71,627 | $106,151 |
| Median | $69,841 | $105,539 |
| Interquartile 25% (IQ1) | $58,586 | $83,438 |
| Interquartile 75% (IQ3) | $85,407 | $126,958 |
| Interquartile Range (IQR) | $26,821 | $43,520 |
| Standard Deviation (Sample) | $20,669 | $35,508 |
| Standard Deviation (Population) | $20,564 | $34,931 |
Similar Demographics by Householder Income Ages 45 - 64 years
Demographics Similar to Dominicans by Householder Income Ages 45 - 64 years
In terms of householder income ages 45 - 64 years, the demographic groups most similar to Dominicans are Immigrants from Cuba ($80,662, a difference of 0.050%), Yup'ik ($81,000, a difference of 0.47%), Seminole ($80,077, a difference of 0.68%), Bahamian ($81,369, a difference of 0.92%), and Native/Alaskan ($79,816, a difference of 1.0%).
| Demographics | Rating | Rank | Householder Income Ages 45 - 64 years |
| Chickasaw | 0.0 /100 | #319 | Tragic $82,193 |
| Apache | 0.0 /100 | #320 | Tragic $82,184 |
| Yuman | 0.0 /100 | #321 | Tragic $82,139 |
| Sioux | 0.0 /100 | #322 | Tragic $81,750 |
| Bahamians | 0.0 /100 | #323 | Tragic $81,369 |
| Yup'ik | 0.0 /100 | #324 | Tragic $81,000 |
| Immigrants | Cuba | 0.0 /100 | #325 | Tragic $80,662 |
| Dominicans | 0.0 /100 | #326 | Tragic $80,623 |
| Seminole | 0.0 /100 | #327 | Tragic $80,077 |
| Natives/Alaskans | 0.0 /100 | #328 | Tragic $79,816 |
| Dutch West Indians | 0.0 /100 | #329 | Tragic $79,171 |
| Creek | 0.0 /100 | #330 | Tragic $78,960 |
| Immigrants | Dominican Republic | 0.0 /100 | #331 | Tragic $78,836 |
| Blacks/African Americans | 0.0 /100 | #332 | Tragic $78,556 |
| Immigrants | Congo | 0.0 /100 | #333 | Tragic $77,850 |
Demographics Similar to Lebanese by Householder Income Ages 45 - 64 years
In terms of householder income ages 45 - 64 years, the demographic groups most similar to Lebanese are Immigrants from Syria ($104,858, a difference of 0.12%), Arab ($104,566, a difference of 0.16%), Canadian ($104,560, a difference of 0.17%), Immigrants from Zimbabwe ($104,992, a difference of 0.25%), and Brazilian ($104,408, a difference of 0.31%).
| Demographics | Rating | Rank | Householder Income Ages 45 - 64 years |
| Pakistanis | 92.4 /100 | #125 | Exceptional $105,317 |
| Portuguese | 92.4 /100 | #126 | Exceptional $105,309 |
| Immigrants | Saudi Arabia | 92.2 /100 | #127 | Exceptional $105,249 |
| Native Hawaiians | 91.8 /100 | #128 | Exceptional $105,149 |
| Peruvians | 91.5 /100 | #129 | Exceptional $105,070 |
| Immigrants | Zimbabwe | 91.2 /100 | #130 | Exceptional $104,992 |
| Immigrants | Syria | 90.7 /100 | #131 | Exceptional $104,858 |
| Lebanese | 90.1 /100 | #132 | Exceptional $104,734 |
| Arabs | 89.3 /100 | #133 | Excellent $104,566 |
| Canadians | 89.3 /100 | #134 | Excellent $104,560 |
| Brazilians | 88.6 /100 | #135 | Excellent $104,408 |
| Taiwanese | 87.4 /100 | #136 | Excellent $104,180 |
| Hungarians | 85.8 /100 | #137 | Excellent $103,913 |
| Ethiopians | 84.7 /100 | #138 | Excellent $103,736 |
| Immigrants | Oceania | 84.5 /100 | #139 | Excellent $103,705 |