Belgian vs Lebanese Single Female Poverty

COMPARE

Belgian
Race
Ancestry
AfghanAfricanAlaska NativeAlaskan AthabascanAlbanianAleutAlsatianAmericanApacheArabArapahoArgentineanArmenianAssyrian/Chaldean/SyriacAustralianAustrianBahamianBangladeshiBarbadianBasqueBelgianBelizeanBermudanBhutaneseBlackfeetBolivianBrazilianBritishBritish West IndianBulgarianBurmeseCajunCambodianCanadianCape VerdeanCarpatho RusynCelticCentral AmericanCentral American IndianCherokeeCheyenneChickasawChileanChineseChippewaChoctawColombianColvilleComancheCosta RicanCreeCreekCroatianCrowCubanCypriotCzechCzechoslovakianDanishDelawareDominicanDutchDutch West IndianEastern EuropeanEcuadorianEgyptianEnglishEstonianEthiopianEuropeanFijianFilipinoFinnishFrenchFrench American IndianFrench CanadianGermanGerman RussianGhanaianGreekGuamanian/ChamorroGuatemalanGuyaneseHaitianHmongHonduranHopiHoumaHungarianIcelanderIndian (Asian)IndonesianInupiatIranianIraqiIrishIroquoisIsraeliItalianJamaicanJapaneseJordanianKenyanKiowaKoreanLaotianLatvianLiberianLithuanianLumbeeLuxembourgerMacedonianMalaysianMalteseMarshalleseMenomineeMexicanMexican American IndianMongolianMoroccanNative HawaiianNavajoNepaleseNew ZealanderNicaraguanNigerianNorthern EuropeanNorwegianOkinawanOsageOttawaPaiutePakistaniPalestinianPanamanianParaguayanPennsylvania GermanPeruvianPimaPolishPortuguesePotawatomiPuebloPuerto RicanPuget Sound SalishRomanianRussianSalvadoranSamoanScandinavianScotch-IrishScottishSeminoleSenegaleseSerbianShoshoneSierra LeoneanSiouxSlavicSlovakSloveneSomaliSouth AfricanSouth AmericanSouth American IndianSoviet UnionSpaniardSpanishSpanish AmericanSpanish American IndianSri LankanSubsaharan AfricanSudaneseSwedishSwissSyrianTaiwaneseThaiTlingit-HaidaTohono O'OdhamTonganTrinidadian and TobagonianTsimshianTurkishU.S. Virgin IslanderUgandanUkrainianUruguayanUteVenezuelanVietnameseWelshWest IndianYakamaYaquiYugoslavianYumanYup'ikZimbabwean
Immigration
NonimmigrantsImmigrantsAfghanistanAfricaAlbaniaArgentinaArmeniaAsiaAustraliaAustriaBahamasBangladeshBarbadosBelarusBelgiumBelizeBoliviaBosnia and HerzegovinaBrazilBulgariaBurma/MyanmarCabo VerdeCambodiaCameroonCanadaCaribbeanCentral AmericaChileChinaColombiaCongoCosta RicaCroatiaCubaCzechoslovakiaDenmarkDominicaDominican RepublicEastern AfricaEastern AsiaEastern EuropeEcuadorEgyptEl SalvadorEnglandEritreaEthiopiaEuropeFijiFranceGermanyGhanaGreeceGrenadaGuatemalaGuyanaHaitiHondurasHong KongHungaryIndiaIndonesiaIranIraqIrelandIsraelItalyJamaicaJapanJordanKazakhstanKenyaKoreaKuwaitLaosLatin AmericaLatviaLebanonLiberiaLithuaniaMalaysiaMexicoMicronesiaMiddle AfricaMoldovaMoroccoNepalNetherlandsNicaraguaNigeriaNorth AmericaNorth MacedoniaNorthern AfricaNorthern EuropeNorwayOceaniaPakistanPanamaPeruPhilippinesPolandPortugalRomaniaRussiaSaudi ArabiaScotlandSenegalSerbiaSierra LeoneSingaporeSomaliaSouth AfricaSouth AmericaSouth Central AsiaSouth Eastern AsiaSouthern EuropeSpainSri LankaSt. Vincent and the GrenadinesSudanSwedenSwitzerlandSyriaTaiwanThailandTrinidad and TobagoTurkeyUgandaUkraineUruguayUzbekistanVenezuelaVietnamWest IndiesWestern AfricaWestern AsiaWestern EuropeYemenZaireZimbabweAzores
Lebanese
Race
Ancestry
AfghanAfricanAlaska NativeAlaskan AthabascanAlbanianAleutAlsatianAmericanApacheArabArapahoArgentineanArmenianAssyrian/Chaldean/SyriacAustralianAustrianBahamianBangladeshiBarbadianBasqueBelizeanBermudanBhutaneseBlackfeetBolivianBrazilianBritishBritish West IndianBulgarianBurmeseCajunCambodianCanadianCape VerdeanCarpatho RusynCelticCentral AmericanCentral American IndianCherokeeCheyenneChickasawChileanChineseChippewaChoctawColombianColvilleComancheCosta RicanCreeCreekCroatianCrowCubanCypriotCzechCzechoslovakianDanishDelawareDominicanDutchDutch West IndianEastern EuropeanEcuadorianEgyptianEnglishEstonianEthiopianEuropeanFijianFilipinoFinnishFrenchFrench American IndianFrench CanadianGermanGerman RussianGhanaianGreekGuamanian/ChamorroGuatemalanGuyaneseHaitianHmongHonduranHopiHoumaHungarianIcelanderIndian (Asian)IndonesianInupiatIranianIraqiIrishIroquoisIsraeliItalianJamaicanJapaneseJordanianKenyanKiowaKoreanLaotianLatvianLebaneseLiberianLithuanianLumbeeLuxembourgerMacedonianMalaysianMalteseMarshalleseMenomineeMexicanMexican American IndianMongolianMoroccanNative HawaiianNavajoNepaleseNew ZealanderNicaraguanNigerianNorthern EuropeanNorwegianOkinawanOsageOttawaPaiutePakistaniPalestinianPanamanianParaguayanPennsylvania GermanPeruvianPimaPolishPortuguesePotawatomiPuebloPuerto RicanPuget Sound SalishRomanianRussianSalvadoranSamoanScandinavianScotch-IrishScottishSeminoleSenegaleseSerbianShoshoneSierra LeoneanSiouxSlavicSlovakSloveneSomaliSouth AfricanSouth AmericanSouth American IndianSoviet UnionSpaniardSpanishSpanish AmericanSpanish American IndianSri LankanSubsaharan AfricanSudaneseSwedishSwissSyrianTaiwaneseThaiTlingit-HaidaTohono O'OdhamTonganTrinidadian and TobagonianTsimshianTurkishU.S. Virgin IslanderUgandanUkrainianUruguayanUteVenezuelanVietnameseWelshWest IndianYakamaYaquiYugoslavianYumanYup'ikZimbabwean
Immigration
NonimmigrantsImmigrantsAfghanistanAfricaAlbaniaArgentinaArmeniaAsiaAustraliaAustriaBahamasBangladeshBarbadosBelarusBelgiumBelizeBoliviaBosnia and HerzegovinaBrazilBulgariaBurma/MyanmarCabo VerdeCambodiaCameroonCanadaCaribbeanCentral AmericaChileChinaColombiaCongoCosta RicaCroatiaCubaCzechoslovakiaDenmarkDominicaDominican RepublicEastern AfricaEastern AsiaEastern EuropeEcuadorEgyptEl SalvadorEnglandEritreaEthiopiaEuropeFijiFranceGermanyGhanaGreeceGrenadaGuatemalaGuyanaHaitiHondurasHong KongHungaryIndiaIndonesiaIranIraqIrelandIsraelItalyJamaicaJapanJordanKazakhstanKenyaKoreaKuwaitLaosLatin AmericaLatviaLebanonLiberiaLithuaniaMalaysiaMexicoMicronesiaMiddle AfricaMoldovaMoroccoNepalNetherlandsNicaraguaNigeriaNorth AmericaNorth MacedoniaNorthern AfricaNorthern EuropeNorwayOceaniaPakistanPanamaPeruPhilippinesPolandPortugalRomaniaRussiaSaudi ArabiaScotlandSenegalSerbiaSierra LeoneSingaporeSomaliaSouth AfricaSouth AmericaSouth Central AsiaSouth Eastern AsiaSouthern EuropeSpainSri LankaSt. Vincent and the GrenadinesSudanSwedenSwitzerlandSyriaTaiwanThailandTrinidad and TobagoTurkeyUgandaUkraineUruguayUzbekistanVenezuelaVietnamWest IndiesWestern AfricaWestern AsiaWestern EuropeYemenZaireZimbabweAzores
Single Female Poverty
Income
Poverty
Unemployment
Labor Participation
Family Structure
Vehicle Availability
Education Level
Disability

Single Female Poverty Comparison

Belgians

Lebanese

Poor
Good
21.5%
SINGLE FEMALE POVERTY
16.1/ 100
METRIC RATING
206th/ 347
METRIC RANK
20.8%
SINGLE FEMALE POVERTY
67.6/ 100
METRIC RATING
163rd/ 347
METRIC RANK

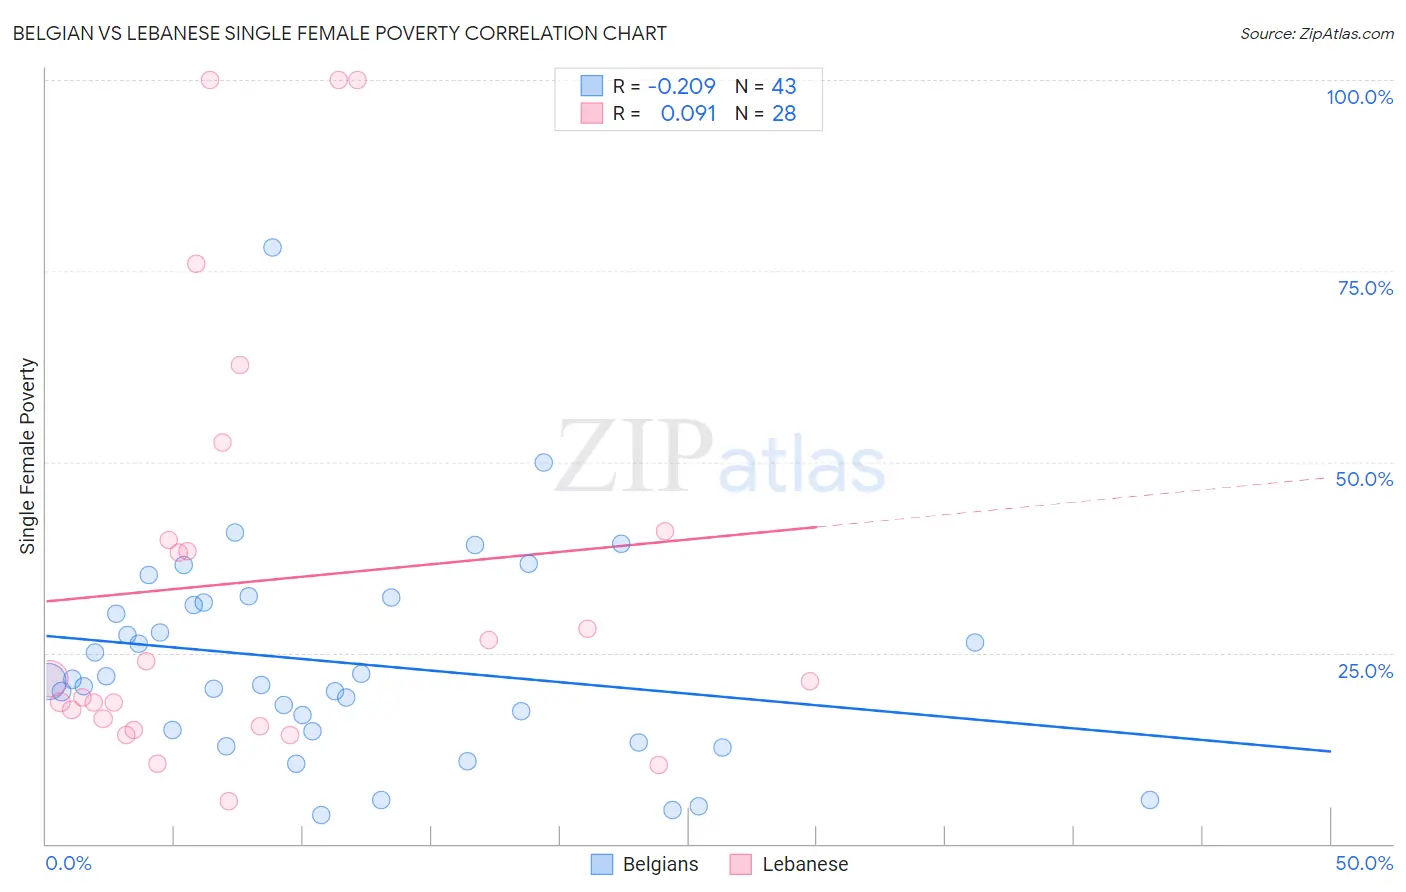
Belgian vs Lebanese Single Female Poverty Correlation Chart

The statistical analysis conducted on geographies consisting of 349,903,575 people shows a weak negative correlation between the proportion of Belgians and poverty level among single females in the United States with a correlation coefficient (R) of -0.209 and weighted average of 21.5%. Similarly, the statistical analysis conducted on geographies consisting of 394,403,389 people shows a slight positive correlation between the proportion of Lebanese and poverty level among single females in the United States with a correlation coefficient (R) of 0.091 and weighted average of 20.8%, a difference of 3.8%.
Belgian vs Lebanese Single Female Poverty

Single Female Poverty Correlation Summary

MeasurementBelgianLebanese
Minimum3.8%5.5%
Maximum78.0%100.0%
Range74.2%94.5%
Mean23.7%34.4%
Median21.2%21.5%
Interquartile 25% (IQ1)14.8%15.8%
Interquartile 75% (IQ3)31.6%40.4%
Interquartile Range (IQR)16.8%24.6%
Standard Deviation (Sample)13.9%28.2%
Standard Deviation (Population)13.7%27.7%

Similar Demographics by Single Female Poverty

Demographics Similar to Belgians by Single Female Poverty

In terms of single female poverty, the demographic groups most similar to Belgians are Finnish (21.5%, a difference of 0.020%), Ghanaian (21.6%, a difference of 0.040%), Immigrants from Africa (21.5%, a difference of 0.070%), Haitian (21.6%, a difference of 0.070%), and Immigrants from Eastern Africa (21.6%, a difference of 0.11%).
DemographicsRating | RankSingle Female Poverty
Immigrants | Immigrants
22.0
/100
|
#199
Fair
21.4%
Irish
21.4
/100
|
#200
Fair
21.4%
Nigerians
20.9
/100
|
#201
Fair
21.4%
Immigrants | Kenya
20.7
/100
|
#202
Fair
21.4%
Immigrants | Haiti
18.8
/100
|
#203
Poor
21.5%
Immigrants | Africa
16.7
/100
|
#204
Poor
21.5%
Finns
16.2
/100
|
#205
Poor
21.5%
Belgians
16.1
/100
|
#206
Poor
21.5%
Ghanaians
15.7
/100
|
#207
Poor
21.6%
Haitians
15.4
/100
|
#208
Poor
21.6%
Immigrants | Eastern Africa
15.1
/100
|
#209
Poor
21.6%
Immigrants | Panama
14.4
/100
|
#210
Poor
21.6%
Icelanders
14.0
/100
|
#211
Poor
21.6%
Jamaicans
14.0
/100
|
#212
Poor
21.6%
Guamanians/Chamorros
13.7
/100
|
#213
Poor
21.6%

Demographics Similar to Lebanese by Single Female Poverty

In terms of single female poverty, the demographic groups most similar to Lebanese are Northern European (20.8%, a difference of 0.050%), Kenyan (20.8%, a difference of 0.060%), Iraqi (20.8%, a difference of 0.22%), Arab (20.7%, a difference of 0.24%), and Ugandan (20.8%, a difference of 0.26%).
DemographicsRating | RankSingle Female Poverty
South American Indians
75.7
/100
|
#156
Good
20.6%
Immigrants | Oceania
74.3
/100
|
#157
Good
20.7%
Danes
73.0
/100
|
#158
Good
20.7%
Costa Ricans
71.8
/100
|
#159
Good
20.7%
Arabs
70.8
/100
|
#160
Good
20.7%
Kenyans
68.5
/100
|
#161
Good
20.8%
Northern Europeans
68.4
/100
|
#162
Good
20.8%
Lebanese
67.6
/100
|
#163
Good
20.8%
Iraqis
64.5
/100
|
#164
Good
20.8%
Ugandans
64.0
/100
|
#165
Good
20.8%
Norwegians
63.0
/100
|
#166
Good
20.8%
Immigrants | Norway
63.0
/100
|
#167
Good
20.8%
Immigrants | Costa Rica
61.5
/100
|
#168
Good
20.9%
Immigrants | Trinidad and Tobago
56.3
/100
|
#169
Average
20.9%
New Zealanders
53.2
/100
|
#170
Average
21.0%