Cambodian vs Lebanese Single Female Poverty
COMPARE
Cambodian
Lebanese
Single Female Poverty
Single Female Poverty Comparison
Cambodians
Lebanese
19.2%
SINGLE FEMALE POVERTY
99.6/ 100
METRIC RATING
61st/ 347
METRIC RANK
20.8%
SINGLE FEMALE POVERTY
67.6/ 100
METRIC RATING
163rd/ 347
METRIC RANK
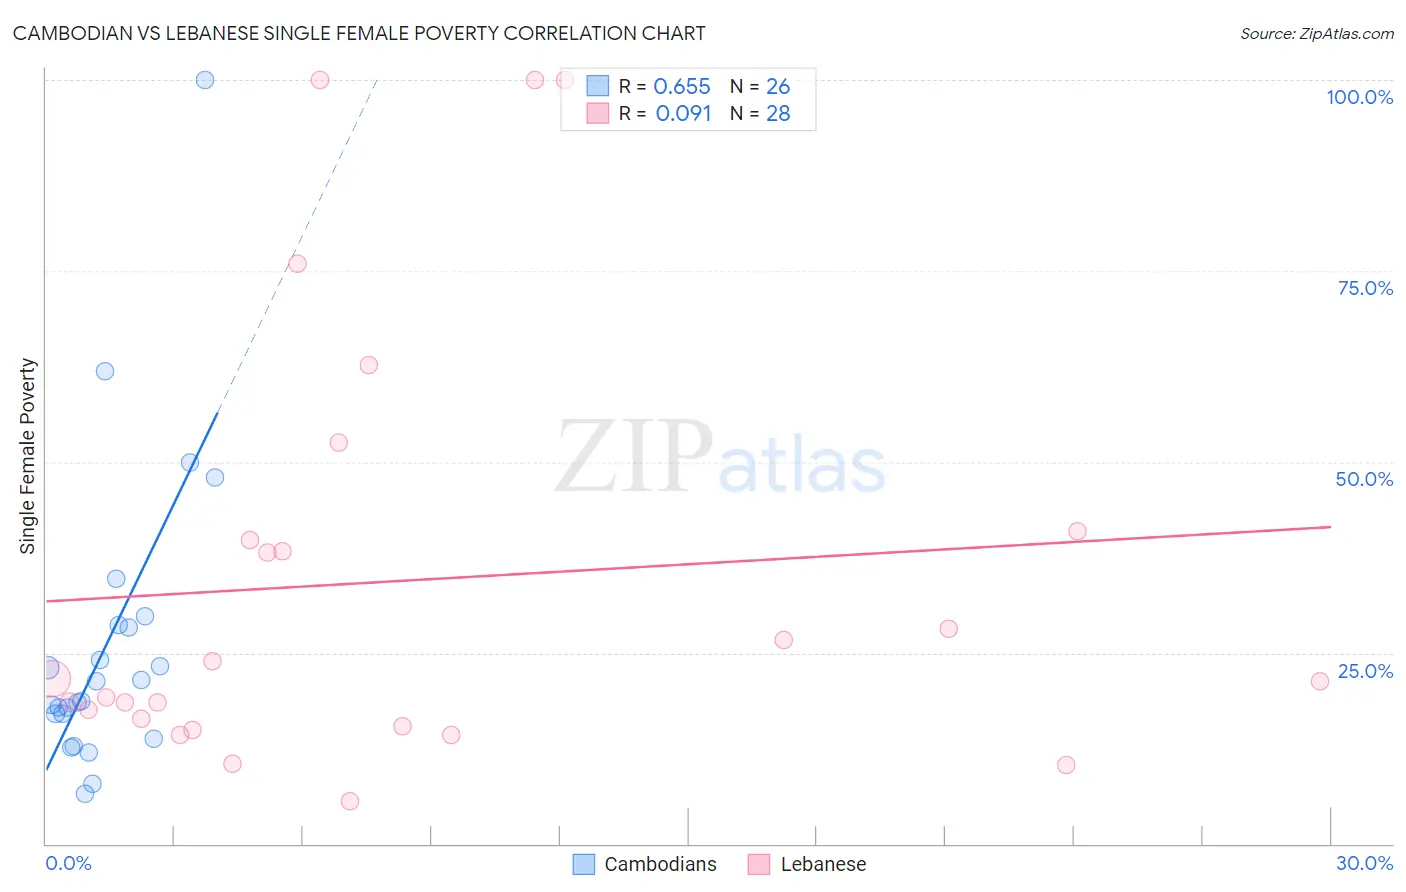
Cambodian vs Lebanese Single Female Poverty Correlation Chart
The statistical analysis conducted on geographies consisting of 102,115,790 people shows a significant positive correlation between the proportion of Cambodians and poverty level among single females in the United States with a correlation coefficient (R) of 0.655 and weighted average of 19.2%. Similarly, the statistical analysis conducted on geographies consisting of 394,403,389 people shows a slight positive correlation between the proportion of Lebanese and poverty level among single females in the United States with a correlation coefficient (R) of 0.091 and weighted average of 20.8%, a difference of 8.2%.
Single Female Poverty Correlation Summary
| Measurement | Cambodian | Lebanese |
| Minimum | 6.6% | 5.5% |
| Maximum | 100.0% | 100.0% |
| Range | 93.4% | 94.5% |
| Mean | 26.3% | 34.4% |
| Median | 19.9% | 21.5% |
| Interquartile 25% (IQ1) | 17.0% | 15.8% |
| Interquartile 75% (IQ3) | 28.6% | 40.4% |
| Interquartile Range (IQR) | 11.6% | 24.6% |
| Standard Deviation (Sample) | 19.9% | 28.2% |
| Standard Deviation (Population) | 19.5% | 27.7% |
Similar Demographics by Single Female Poverty
Demographics Similar to Cambodians by Single Female Poverty
In terms of single female poverty, the demographic groups most similar to Cambodians are Russian (19.2%, a difference of 0.020%), Lithuanian (19.2%, a difference of 0.050%), Sri Lankan (19.2%, a difference of 0.12%), Immigrants from Northern Europe (19.2%, a difference of 0.17%), and Immigrants from Europe (19.2%, a difference of 0.18%).
| Demographics | Rating | Rank | Single Female Poverty |
| Argentineans | 99.7 /100 | #54 | Exceptional 19.1% |
| Immigrants | Vietnam | 99.7 /100 | #55 | Exceptional 19.1% |
| Immigrants | Fiji | 99.7 /100 | #56 | Exceptional 19.1% |
| Eastern Europeans | 99.7 /100 | #57 | Exceptional 19.1% |
| Immigrants | Bulgaria | 99.7 /100 | #58 | Exceptional 19.1% |
| Sri Lankans | 99.6 /100 | #59 | Exceptional 19.2% |
| Russians | 99.6 /100 | #60 | Exceptional 19.2% |
| Cambodians | 99.6 /100 | #61 | Exceptional 19.2% |
| Lithuanians | 99.6 /100 | #62 | Exceptional 19.2% |
| Immigrants | Northern Europe | 99.6 /100 | #63 | Exceptional 19.2% |
| Immigrants | Europe | 99.6 /100 | #64 | Exceptional 19.2% |
| Cypriots | 99.6 /100 | #65 | Exceptional 19.2% |
| Palestinians | 99.6 /100 | #66 | Exceptional 19.2% |
| Immigrants | Egypt | 99.6 /100 | #67 | Exceptional 19.2% |
| Laotians | 99.5 /100 | #68 | Exceptional 19.3% |
Demographics Similar to Lebanese by Single Female Poverty
In terms of single female poverty, the demographic groups most similar to Lebanese are Northern European (20.8%, a difference of 0.050%), Kenyan (20.8%, a difference of 0.060%), Iraqi (20.8%, a difference of 0.22%), Arab (20.7%, a difference of 0.24%), and Ugandan (20.8%, a difference of 0.26%).
| Demographics | Rating | Rank | Single Female Poverty |
| South American Indians | 75.7 /100 | #156 | Good 20.6% |
| Immigrants | Oceania | 74.3 /100 | #157 | Good 20.7% |
| Danes | 73.0 /100 | #158 | Good 20.7% |
| Costa Ricans | 71.8 /100 | #159 | Good 20.7% |
| Arabs | 70.8 /100 | #160 | Good 20.7% |
| Kenyans | 68.5 /100 | #161 | Good 20.8% |
| Northern Europeans | 68.4 /100 | #162 | Good 20.8% |
| Lebanese | 67.6 /100 | #163 | Good 20.8% |
| Iraqis | 64.5 /100 | #164 | Good 20.8% |
| Ugandans | 64.0 /100 | #165 | Good 20.8% |
| Norwegians | 63.0 /100 | #166 | Good 20.8% |
| Immigrants | Norway | 63.0 /100 | #167 | Good 20.8% |
| Immigrants | Costa Rica | 61.5 /100 | #168 | Good 20.9% |
| Immigrants | Trinidad and Tobago | 56.3 /100 | #169 | Average 20.9% |
| New Zealanders | 53.2 /100 | #170 | Average 21.0% |