Czech vs Immigrants from Sudan Single Male Poverty
COMPARE
Czech
Immigrants from Sudan
Single Male Poverty
Single Male Poverty Comparison
Czechs
Immigrants from Sudan
13.5%
SINGLE MALE POVERTY
1.2/ 100
METRIC RATING
248th/ 347
METRIC RANK
12.7%
SINGLE MALE POVERTY
58.2/ 100
METRIC RATING
167th/ 347
METRIC RANK
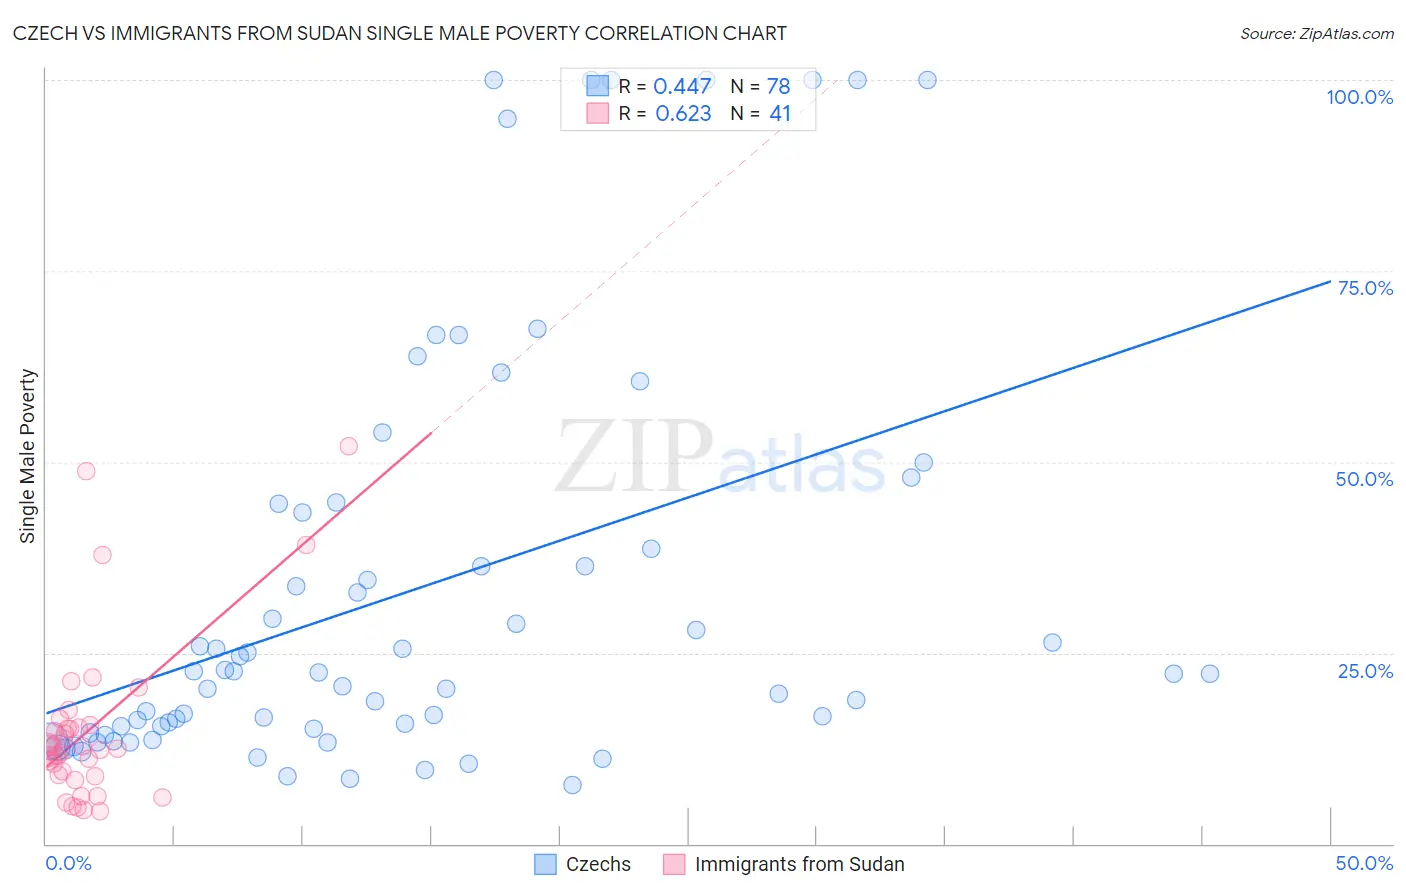
Czech vs Immigrants from Sudan Single Male Poverty Correlation Chart
The statistical analysis conducted on geographies consisting of 410,747,171 people shows a moderate positive correlation between the proportion of Czechs and poverty level among single males in the United States with a correlation coefficient (R) of 0.447 and weighted average of 13.5%. Similarly, the statistical analysis conducted on geographies consisting of 114,680,115 people shows a significant positive correlation between the proportion of Immigrants from Sudan and poverty level among single males in the United States with a correlation coefficient (R) of 0.623 and weighted average of 12.7%, a difference of 6.3%.
Single Male Poverty Correlation Summary
| Measurement | Czech | Immigrants from Sudan |
| Minimum | 7.7% | 4.2% |
| Maximum | 100.0% | 52.0% |
| Range | 92.3% | 47.8% |
| Mean | 33.2% | 14.9% |
| Median | 22.4% | 12.5% |
| Interquartile 25% (IQ1) | 15.1% | 8.9% |
| Interquartile 75% (IQ3) | 43.3% | 15.4% |
| Interquartile Range (IQR) | 28.3% | 6.5% |
| Standard Deviation (Sample) | 27.1% | 10.9% |
| Standard Deviation (Population) | 26.9% | 10.8% |
Similar Demographics by Single Male Poverty
Demographics Similar to Czechs by Single Male Poverty
In terms of single male poverty, the demographic groups most similar to Czechs are Belgian (13.5%, a difference of 0.030%), Immigrants from Micronesia (13.5%, a difference of 0.040%), Immigrants from Latin America (13.5%, a difference of 0.14%), Spanish (13.6%, a difference of 0.24%), and Immigrants from Somalia (13.6%, a difference of 0.26%).
| Demographics | Rating | Rank | Single Male Poverty |
| Immigrants | Germany | 2.1 /100 | #241 | Tragic 13.4% |
| Carpatho Rusyns | 2.1 /100 | #242 | Tragic 13.4% |
| Barbadians | 2.1 /100 | #243 | Tragic 13.4% |
| Immigrants | Senegal | 1.7 /100 | #244 | Tragic 13.5% |
| Immigrants | Latin America | 1.3 /100 | #245 | Tragic 13.5% |
| Immigrants | Micronesia | 1.2 /100 | #246 | Tragic 13.5% |
| Belgians | 1.2 /100 | #247 | Tragic 13.5% |
| Czechs | 1.2 /100 | #248 | Tragic 13.5% |
| Spanish | 1.0 /100 | #249 | Tragic 13.6% |
| Immigrants | Somalia | 1.0 /100 | #250 | Tragic 13.6% |
| Immigrants | Zaire | 0.9 /100 | #251 | Tragic 13.6% |
| Finns | 0.9 /100 | #252 | Tragic 13.6% |
| German Russians | 0.8 /100 | #253 | Tragic 13.6% |
| Sub-Saharan Africans | 0.5 /100 | #254 | Tragic 13.7% |
| Spaniards | 0.4 /100 | #255 | Tragic 13.7% |
Demographics Similar to Immigrants from Sudan by Single Male Poverty
In terms of single male poverty, the demographic groups most similar to Immigrants from Sudan are Immigrants from Barbados (12.7%, a difference of 0.030%), Immigrants from Guyana (12.7%, a difference of 0.13%), Puget Sound Salish (12.8%, a difference of 0.21%), Immigrants from Cambodia (12.7%, a difference of 0.22%), and Immigrants from Nigeria (12.7%, a difference of 0.26%).
| Demographics | Rating | Rank | Single Male Poverty |
| Greeks | 64.1 /100 | #160 | Good 12.7% |
| Immigrants | Africa | 63.4 /100 | #161 | Good 12.7% |
| Eastern Europeans | 63.3 /100 | #162 | Good 12.7% |
| Palestinians | 63.1 /100 | #163 | Good 12.7% |
| Immigrants | Nigeria | 62.8 /100 | #164 | Good 12.7% |
| Immigrants | Cambodia | 62.2 /100 | #165 | Good 12.7% |
| Immigrants | Guyana | 60.5 /100 | #166 | Good 12.7% |
| Immigrants | Sudan | 58.2 /100 | #167 | Average 12.7% |
| Immigrants | Barbados | 57.7 /100 | #168 | Average 12.7% |
| Puget Sound Salish | 54.3 /100 | #169 | Average 12.8% |
| Guyanese | 52.0 /100 | #170 | Average 12.8% |
| South Africans | 51.5 /100 | #171 | Average 12.8% |
| Danes | 51.4 /100 | #172 | Average 12.8% |
| Immigrants | St. Vincent and the Grenadines | 50.9 /100 | #173 | Average 12.8% |
| Costa Ricans | 50.0 /100 | #174 | Average 12.8% |