Crow vs Hungarian Single Female Poverty
COMPARE
Crow
Hungarian
Single Female Poverty
Single Female Poverty Comparison
Crow
Hungarians
32.4%
SINGLE FEMALE POVERTY
0.0/ 100
METRIC RATING
343rd/ 347
METRIC RANK
21.1%
SINGLE FEMALE POVERTY
39.6/ 100
METRIC RATING
184th/ 347
METRIC RANK
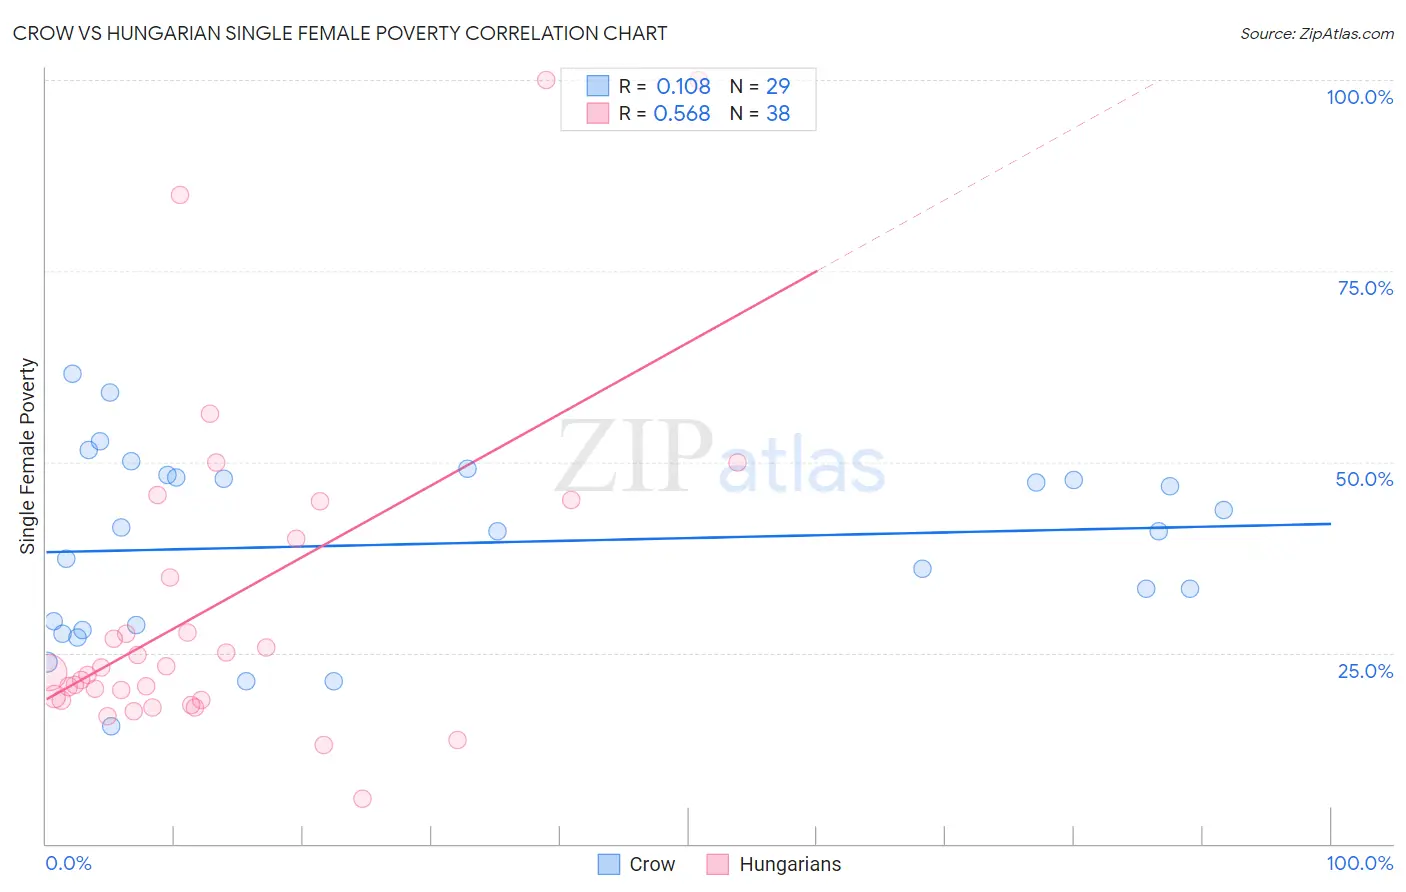
Crow vs Hungarian Single Female Poverty Correlation Chart
The statistical analysis conducted on geographies consisting of 58,998,568 people shows a poor positive correlation between the proportion of Crow and poverty level among single females in the United States with a correlation coefficient (R) of 0.108 and weighted average of 32.4%. Similarly, the statistical analysis conducted on geographies consisting of 473,502,236 people shows a substantial positive correlation between the proportion of Hungarians and poverty level among single females in the United States with a correlation coefficient (R) of 0.568 and weighted average of 21.1%, a difference of 53.3%.
Single Female Poverty Correlation Summary
| Measurement | Crow | Hungarian |
| Minimum | 15.4% | 6.0% |
| Maximum | 61.5% | 100.0% |
| Range | 46.1% | 94.0% |
| Mean | 39.3% | 31.6% |
| Median | 40.9% | 22.7% |
| Interquartile 25% (IQ1) | 28.3% | 18.9% |
| Interquartile 75% (IQ3) | 48.1% | 40.0% |
| Interquartile Range (IQR) | 19.8% | 21.1% |
| Standard Deviation (Sample) | 12.0% | 22.1% |
| Standard Deviation (Population) | 11.8% | 21.8% |
Similar Demographics by Single Female Poverty
Demographics Similar to Crow by Single Female Poverty
In terms of single female poverty, the demographic groups most similar to Crow are Lumbee (33.0%, a difference of 1.8%), Navajo (31.7%, a difference of 2.4%), Sioux (31.3%, a difference of 3.7%), Houma (33.8%, a difference of 4.3%), and Puerto Rican (34.1%, a difference of 5.2%).
| Demographics | Rating | Rank | Single Female Poverty |
| Ute | 0.0 /100 | #333 | Tragic 28.4% |
| Pueblo | 0.0 /100 | #334 | Tragic 28.6% |
| Immigrants | Yemen | 0.0 /100 | #335 | Tragic 28.9% |
| Colville | 0.0 /100 | #336 | Tragic 29.1% |
| Yuman | 0.0 /100 | #337 | Tragic 29.4% |
| Pima | 0.0 /100 | #338 | Tragic 30.3% |
| Cheyenne | 0.0 /100 | #339 | Tragic 30.4% |
| Cajuns | 0.0 /100 | #340 | Tragic 30.6% |
| Sioux | 0.0 /100 | #341 | Tragic 31.3% |
| Navajo | 0.0 /100 | #342 | Tragic 31.7% |
| Crow | 0.0 /100 | #343 | Tragic 32.4% |
| Lumbee | 0.0 /100 | #344 | Tragic 33.0% |
| Houma | 0.0 /100 | #345 | Tragic 33.8% |
| Puerto Ricans | 0.0 /100 | #346 | Tragic 34.1% |
| Tohono O'odham | 0.0 /100 | #347 | Tragic 34.2% |
Demographics Similar to Hungarians by Single Female Poverty
In terms of single female poverty, the demographic groups most similar to Hungarians are Slovak (21.1%, a difference of 0.010%), Slavic (21.1%, a difference of 0.060%), Immigrants from Cambodia (21.2%, a difference of 0.090%), Hawaiian (21.2%, a difference of 0.13%), and Spanish American Indian (21.1%, a difference of 0.18%).
| Demographics | Rating | Rank | Single Female Poverty |
| Scandinavians | 45.2 /100 | #177 | Average 21.1% |
| Immigrants | Bosnia and Herzegovina | 44.9 /100 | #178 | Average 21.1% |
| British | 42.9 /100 | #179 | Average 21.1% |
| Spanish American Indians | 42.5 /100 | #180 | Average 21.1% |
| Europeans | 42.3 /100 | #181 | Average 21.1% |
| Slavs | 40.5 /100 | #182 | Average 21.1% |
| Slovaks | 39.7 /100 | #183 | Fair 21.1% |
| Hungarians | 39.6 /100 | #184 | Fair 21.1% |
| Immigrants | Cambodia | 38.2 /100 | #185 | Fair 21.2% |
| Hawaiians | 37.7 /100 | #186 | Fair 21.2% |
| Immigrants | Nigeria | 36.8 /100 | #187 | Fair 21.2% |
| Yugoslavians | 35.4 /100 | #188 | Fair 21.2% |
| Immigrants | Cuba | 35.3 /100 | #189 | Fair 21.2% |
| Trinidadians and Tobagonians | 35.2 /100 | #190 | Fair 21.2% |
| Immigrants | Germany | 31.1 /100 | #191 | Fair 21.3% |