Crow vs Guatemalan Single Female Poverty
COMPARE
Crow
Guatemalan
Single Female Poverty
Single Female Poverty Comparison
Crow
Guatemalans
32.4%
SINGLE FEMALE POVERTY
0.0/ 100
METRIC RATING
343rd/ 347
METRIC RANK
23.8%
SINGLE FEMALE POVERTY
0.0/ 100
METRIC RATING
282nd/ 347
METRIC RANK
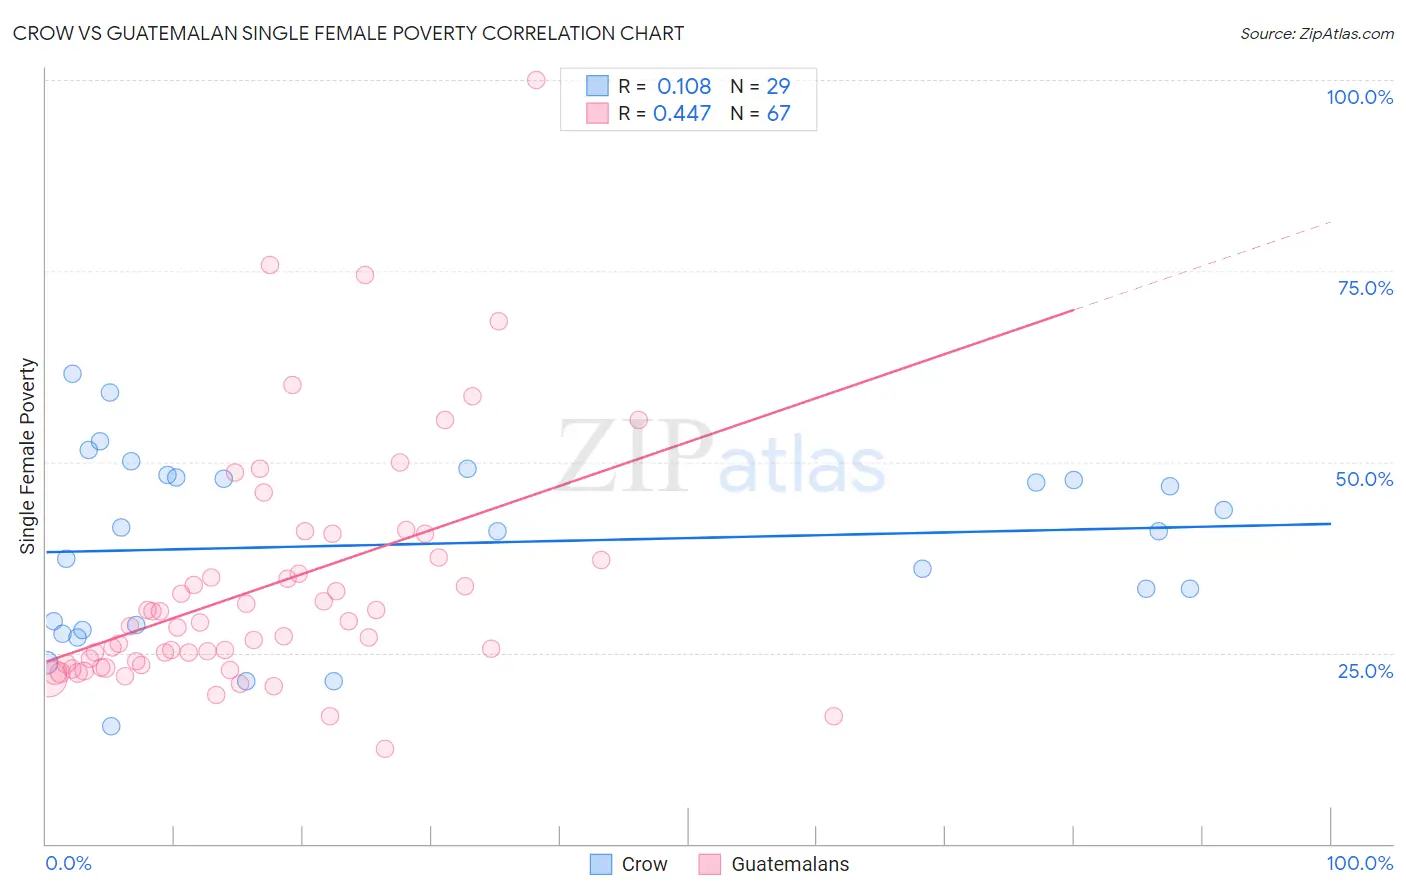
Crow vs Guatemalan Single Female Poverty Correlation Chart
The statistical analysis conducted on geographies consisting of 58,998,568 people shows a poor positive correlation between the proportion of Crow and poverty level among single females in the United States with a correlation coefficient (R) of 0.108 and weighted average of 32.4%. Similarly, the statistical analysis conducted on geographies consisting of 404,542,149 people shows a moderate positive correlation between the proportion of Guatemalans and poverty level among single females in the United States with a correlation coefficient (R) of 0.447 and weighted average of 23.8%, a difference of 35.9%.
Single Female Poverty Correlation Summary
| Measurement | Crow | Guatemalan |
| Minimum | 15.4% | 12.4% |
| Maximum | 61.5% | 100.0% |
| Range | 46.1% | 87.6% |
| Mean | 39.3% | 33.7% |
| Median | 40.9% | 28.4% |
| Interquartile 25% (IQ1) | 28.3% | 23.4% |
| Interquartile 75% (IQ3) | 48.1% | 37.5% |
| Interquartile Range (IQR) | 19.8% | 14.1% |
| Standard Deviation (Sample) | 12.0% | 15.8% |
| Standard Deviation (Population) | 11.8% | 15.7% |
Similar Demographics by Single Female Poverty
Demographics Similar to Crow by Single Female Poverty
In terms of single female poverty, the demographic groups most similar to Crow are Lumbee (33.0%, a difference of 1.8%), Navajo (31.7%, a difference of 2.4%), Sioux (31.3%, a difference of 3.7%), Houma (33.8%, a difference of 4.3%), and Puerto Rican (34.1%, a difference of 5.2%).
| Demographics | Rating | Rank | Single Female Poverty |
| Ute | 0.0 /100 | #333 | Tragic 28.4% |
| Pueblo | 0.0 /100 | #334 | Tragic 28.6% |
| Immigrants | Yemen | 0.0 /100 | #335 | Tragic 28.9% |
| Colville | 0.0 /100 | #336 | Tragic 29.1% |
| Yuman | 0.0 /100 | #337 | Tragic 29.4% |
| Pima | 0.0 /100 | #338 | Tragic 30.3% |
| Cheyenne | 0.0 /100 | #339 | Tragic 30.4% |
| Cajuns | 0.0 /100 | #340 | Tragic 30.6% |
| Sioux | 0.0 /100 | #341 | Tragic 31.3% |
| Navajo | 0.0 /100 | #342 | Tragic 31.7% |
| Crow | 0.0 /100 | #343 | Tragic 32.4% |
| Lumbee | 0.0 /100 | #344 | Tragic 33.0% |
| Houma | 0.0 /100 | #345 | Tragic 33.8% |
| Puerto Ricans | 0.0 /100 | #346 | Tragic 34.1% |
| Tohono O'odham | 0.0 /100 | #347 | Tragic 34.2% |
Demographics Similar to Guatemalans by Single Female Poverty
In terms of single female poverty, the demographic groups most similar to Guatemalans are Immigrants from Zaire (23.8%, a difference of 0.050%), German Russian (23.9%, a difference of 0.14%), Immigrants from Dominica (23.9%, a difference of 0.25%), Immigrants from Latin America (23.7%, a difference of 0.56%), and Alaskan Athabascan (23.6%, a difference of 1.1%).
| Demographics | Rating | Rank | Single Female Poverty |
| Mexican American Indians | 0.1 /100 | #275 | Tragic 23.4% |
| Immigrants | Azores | 0.0 /100 | #276 | Tragic 23.5% |
| Pennsylvania Germans | 0.0 /100 | #277 | Tragic 23.6% |
| Immigrants | Nonimmigrants | 0.0 /100 | #278 | Tragic 23.6% |
| Alaskan Athabascans | 0.0 /100 | #279 | Tragic 23.6% |
| Immigrants | Latin America | 0.0 /100 | #280 | Tragic 23.7% |
| Immigrants | Zaire | 0.0 /100 | #281 | Tragic 23.8% |
| Guatemalans | 0.0 /100 | #282 | Tragic 23.8% |
| German Russians | 0.0 /100 | #283 | Tragic 23.9% |
| Immigrants | Dominica | 0.0 /100 | #284 | Tragic 23.9% |
| Immigrants | Guatemala | 0.0 /100 | #285 | Tragic 24.1% |
| Cree | 0.0 /100 | #286 | Tragic 24.1% |
| Bangladeshis | 0.0 /100 | #287 | Tragic 24.2% |
| Spanish Americans | 0.0 /100 | #288 | Tragic 24.2% |
| U.S. Virgin Islanders | 0.0 /100 | #289 | Tragic 24.2% |