Immigrants from Haiti vs Hungarian Single Female Poverty
COMPARE
Immigrants from Haiti
Hungarian
Single Female Poverty
Single Female Poverty Comparison
Immigrants from Haiti
Hungarians
21.5%
SINGLE FEMALE POVERTY
18.8/ 100
METRIC RATING
203rd/ 347
METRIC RANK
21.1%
SINGLE FEMALE POVERTY
39.6/ 100
METRIC RATING
184th/ 347
METRIC RANK
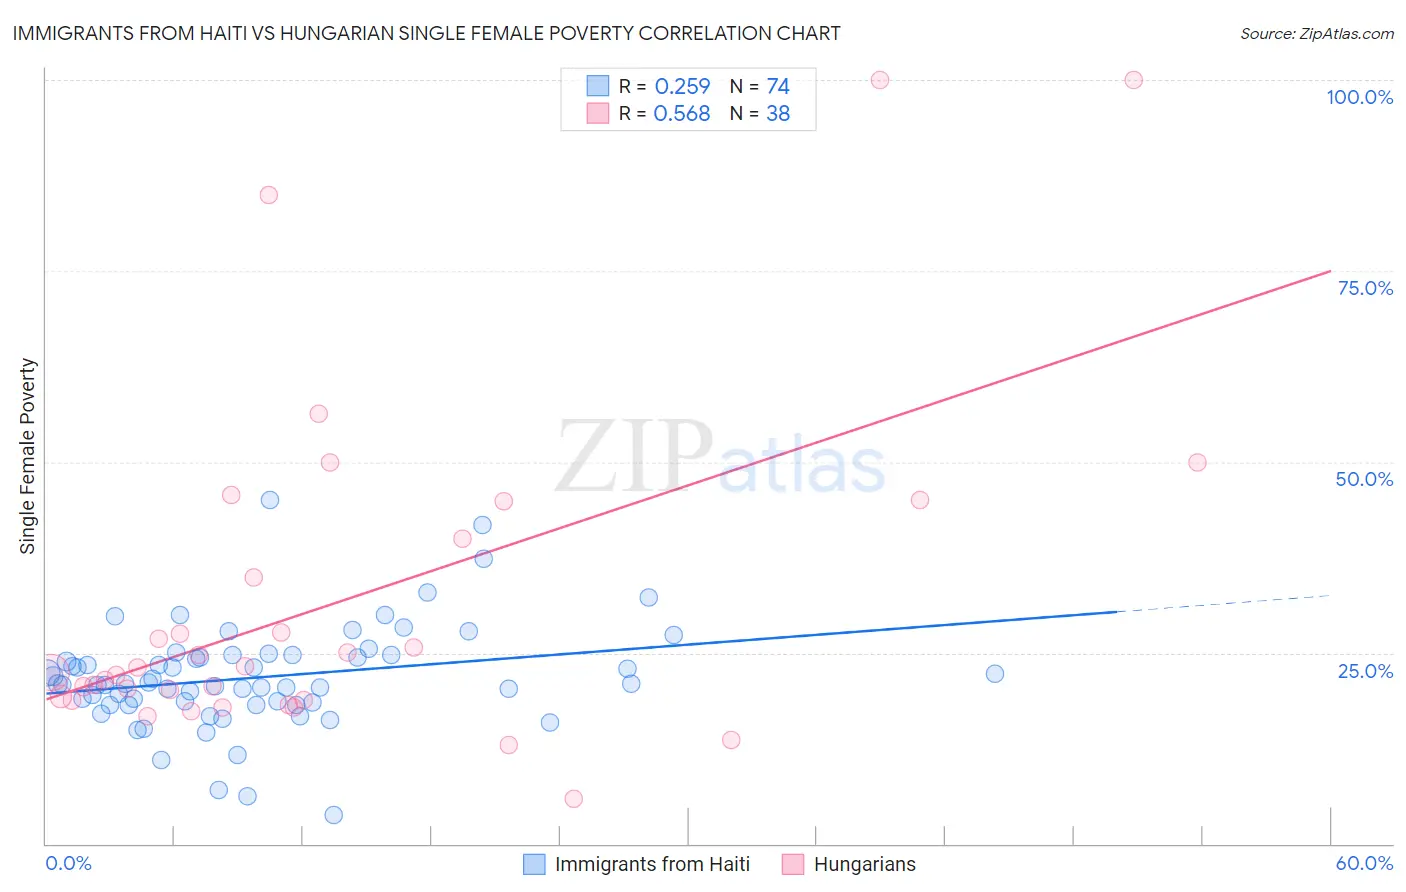
Immigrants from Haiti vs Hungarian Single Female Poverty Correlation Chart
The statistical analysis conducted on geographies consisting of 223,147,681 people shows a weak positive correlation between the proportion of Immigrants from Haiti and poverty level among single females in the United States with a correlation coefficient (R) of 0.259 and weighted average of 21.5%. Similarly, the statistical analysis conducted on geographies consisting of 473,502,236 people shows a substantial positive correlation between the proportion of Hungarians and poverty level among single females in the United States with a correlation coefficient (R) of 0.568 and weighted average of 21.1%, a difference of 1.6%.
Single Female Poverty Correlation Summary
| Measurement | Immigrants from Haiti | Hungarian |
| Minimum | 3.7% | 6.0% |
| Maximum | 45.0% | 100.0% |
| Range | 41.2% | 94.0% |
| Mean | 21.8% | 31.6% |
| Median | 20.9% | 22.7% |
| Interquartile 25% (IQ1) | 18.5% | 18.9% |
| Interquartile 75% (IQ3) | 24.7% | 40.0% |
| Interquartile Range (IQR) | 6.2% | 21.1% |
| Standard Deviation (Sample) | 6.8% | 22.1% |
| Standard Deviation (Population) | 6.7% | 21.8% |
Demographics Similar to Immigrants from Haiti and Hungarians by Single Female Poverty
In terms of single female poverty, the demographic groups most similar to Immigrants from Haiti are Immigrants from Kenya (21.4%, a difference of 0.18%), Nigerian (21.4%, a difference of 0.20%), Irish (21.4%, a difference of 0.25%), Immigrants (21.4%, a difference of 0.30%), and Swiss (21.4%, a difference of 0.49%). Similarly, the demographic groups most similar to Hungarians are Slovak (21.1%, a difference of 0.010%), Immigrants from Cambodia (21.2%, a difference of 0.090%), Hawaiian (21.2%, a difference of 0.13%), Immigrants from Nigeria (21.2%, a difference of 0.19%), and Yugoslavian (21.2%, a difference of 0.27%).
| Demographics | Rating | Rank | Single Female Poverty |
| Slovaks | 39.7 /100 | #183 | Fair 21.1% |
| Hungarians | 39.6 /100 | #184 | Fair 21.1% |
| Immigrants | Cambodia | 38.2 /100 | #185 | Fair 21.2% |
| Hawaiians | 37.7 /100 | #186 | Fair 21.2% |
| Immigrants | Nigeria | 36.8 /100 | #187 | Fair 21.2% |
| Yugoslavians | 35.4 /100 | #188 | Fair 21.2% |
| Immigrants | Cuba | 35.3 /100 | #189 | Fair 21.2% |
| Trinidadians and Tobagonians | 35.2 /100 | #190 | Fair 21.2% |
| Immigrants | Germany | 31.1 /100 | #191 | Fair 21.3% |
| Immigrants | Jamaica | 30.5 /100 | #192 | Fair 21.3% |
| Basques | 28.1 /100 | #193 | Fair 21.3% |
| Czechoslovakians | 27.7 /100 | #194 | Fair 21.3% |
| Nicaraguans | 27.6 /100 | #195 | Fair 21.3% |
| Immigrants | Saudi Arabia | 27.1 /100 | #196 | Fair 21.3% |
| Japanese | 26.4 /100 | #197 | Fair 21.3% |
| Swiss | 24.2 /100 | #198 | Fair 21.4% |
| Immigrants | Immigrants | 22.0 /100 | #199 | Fair 21.4% |
| Irish | 21.4 /100 | #200 | Fair 21.4% |
| Nigerians | 20.9 /100 | #201 | Fair 21.4% |
| Immigrants | Kenya | 20.7 /100 | #202 | Fair 21.4% |
| Immigrants | Haiti | 18.8 /100 | #203 | Poor 21.5% |