Crow vs Immigrants from Vietnam Single Female Poverty
COMPARE
Crow
Immigrants from Vietnam
Single Female Poverty
Single Female Poverty Comparison
Crow
Immigrants from Vietnam
32.4%
SINGLE FEMALE POVERTY
0.0/ 100
METRIC RATING
343rd/ 347
METRIC RANK
19.1%
SINGLE FEMALE POVERTY
99.7/ 100
METRIC RATING
55th/ 347
METRIC RANK
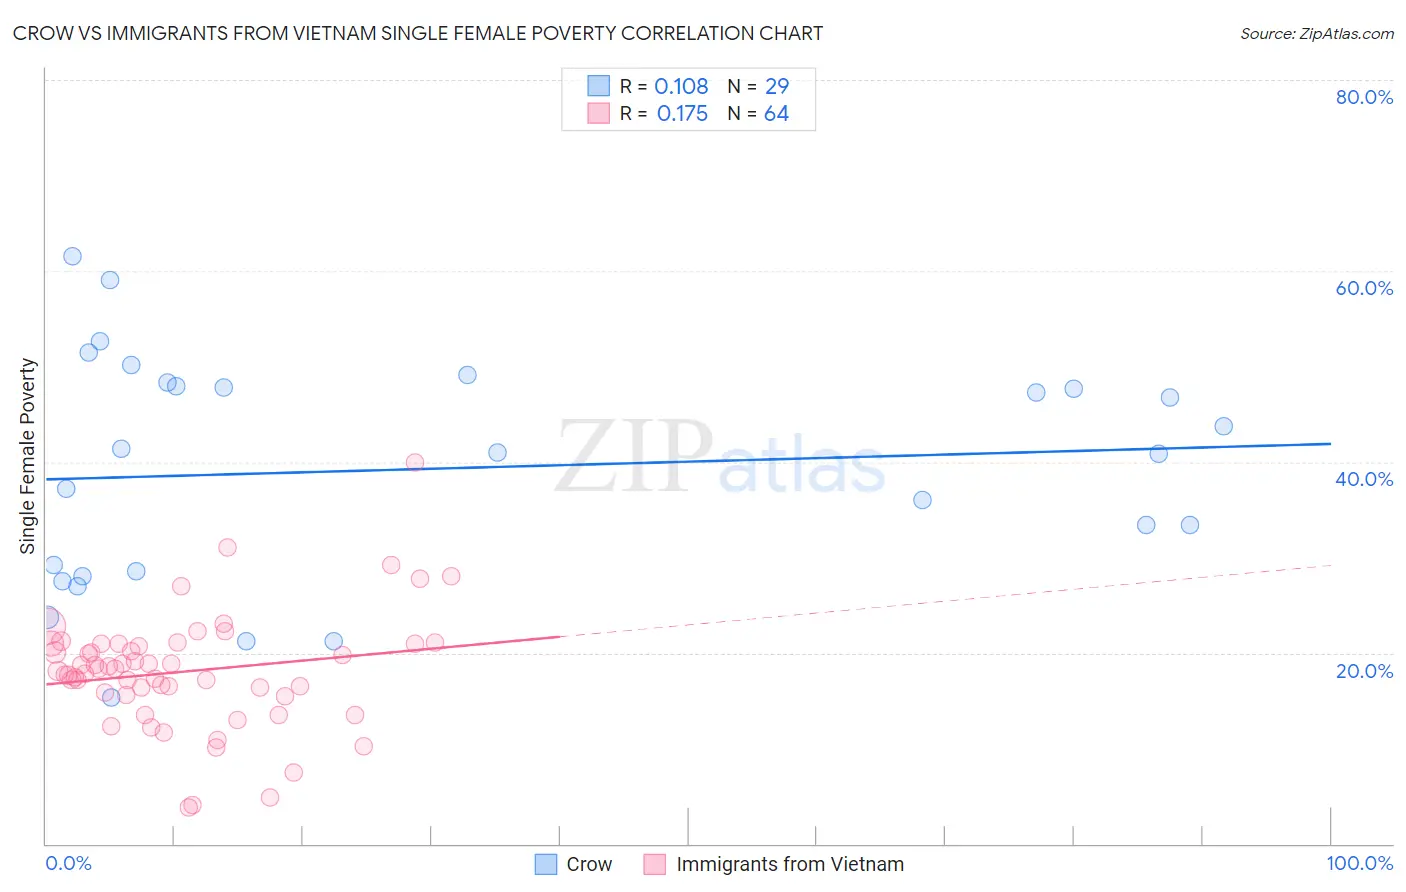
Crow vs Immigrants from Vietnam Single Female Poverty Correlation Chart
The statistical analysis conducted on geographies consisting of 58,998,568 people shows a poor positive correlation between the proportion of Crow and poverty level among single females in the United States with a correlation coefficient (R) of 0.108 and weighted average of 32.4%. Similarly, the statistical analysis conducted on geographies consisting of 399,262,621 people shows a poor positive correlation between the proportion of Immigrants from Vietnam and poverty level among single females in the United States with a correlation coefficient (R) of 0.175 and weighted average of 19.1%, a difference of 69.6%.
Single Female Poverty Correlation Summary
| Measurement | Crow | Immigrants from Vietnam |
| Minimum | 15.4% | 3.8% |
| Maximum | 61.5% | 40.0% |
| Range | 46.1% | 36.2% |
| Mean | 39.3% | 18.0% |
| Median | 40.9% | 18.2% |
| Interquartile 25% (IQ1) | 28.3% | 15.7% |
| Interquartile 75% (IQ3) | 48.1% | 20.9% |
| Interquartile Range (IQR) | 19.8% | 5.3% |
| Standard Deviation (Sample) | 12.0% | 6.1% |
| Standard Deviation (Population) | 11.8% | 6.0% |
Similar Demographics by Single Female Poverty
Demographics Similar to Crow by Single Female Poverty
In terms of single female poverty, the demographic groups most similar to Crow are Lumbee (33.0%, a difference of 1.8%), Navajo (31.7%, a difference of 2.4%), Sioux (31.3%, a difference of 3.7%), Houma (33.8%, a difference of 4.3%), and Puerto Rican (34.1%, a difference of 5.2%).
| Demographics | Rating | Rank | Single Female Poverty |
| Ute | 0.0 /100 | #333 | Tragic 28.4% |
| Pueblo | 0.0 /100 | #334 | Tragic 28.6% |
| Immigrants | Yemen | 0.0 /100 | #335 | Tragic 28.9% |
| Colville | 0.0 /100 | #336 | Tragic 29.1% |
| Yuman | 0.0 /100 | #337 | Tragic 29.4% |
| Pima | 0.0 /100 | #338 | Tragic 30.3% |
| Cheyenne | 0.0 /100 | #339 | Tragic 30.4% |
| Cajuns | 0.0 /100 | #340 | Tragic 30.6% |
| Sioux | 0.0 /100 | #341 | Tragic 31.3% |
| Navajo | 0.0 /100 | #342 | Tragic 31.7% |
| Crow | 0.0 /100 | #343 | Tragic 32.4% |
| Lumbee | 0.0 /100 | #344 | Tragic 33.0% |
| Houma | 0.0 /100 | #345 | Tragic 33.8% |
| Puerto Ricans | 0.0 /100 | #346 | Tragic 34.1% |
| Tohono O'odham | 0.0 /100 | #347 | Tragic 34.2% |
Demographics Similar to Immigrants from Vietnam by Single Female Poverty
In terms of single female poverty, the demographic groups most similar to Immigrants from Vietnam are Argentinean (19.1%, a difference of 0.040%), Tsimshian (19.1%, a difference of 0.050%), Immigrants from Fiji (19.1%, a difference of 0.050%), Eastern European (19.1%, a difference of 0.11%), and Immigrants from Bulgaria (19.1%, a difference of 0.23%).
| Demographics | Rating | Rank | Single Female Poverty |
| Immigrants | Argentina | 99.8 /100 | #48 | Exceptional 19.0% |
| Immigrants | Czechoslovakia | 99.8 /100 | #49 | Exceptional 19.0% |
| Immigrants | Eastern Europe | 99.8 /100 | #50 | Exceptional 19.0% |
| Immigrants | Italy | 99.8 /100 | #51 | Exceptional 19.0% |
| Egyptians | 99.7 /100 | #52 | Exceptional 19.1% |
| Tsimshian | 99.7 /100 | #53 | Exceptional 19.1% |
| Argentineans | 99.7 /100 | #54 | Exceptional 19.1% |
| Immigrants | Vietnam | 99.7 /100 | #55 | Exceptional 19.1% |
| Immigrants | Fiji | 99.7 /100 | #56 | Exceptional 19.1% |
| Eastern Europeans | 99.7 /100 | #57 | Exceptional 19.1% |
| Immigrants | Bulgaria | 99.7 /100 | #58 | Exceptional 19.1% |
| Sri Lankans | 99.6 /100 | #59 | Exceptional 19.2% |
| Russians | 99.6 /100 | #60 | Exceptional 19.2% |
| Cambodians | 99.6 /100 | #61 | Exceptional 19.2% |
| Lithuanians | 99.6 /100 | #62 | Exceptional 19.2% |