Crow vs Immigrants from South Central Asia Single Female Poverty
COMPARE
Crow
Immigrants from South Central Asia
Single Female Poverty
Single Female Poverty Comparison
Crow
Immigrants from South Central Asia
32.4%
SINGLE FEMALE POVERTY
0.0/ 100
METRIC RATING
343rd/ 347
METRIC RANK
17.8%
SINGLE FEMALE POVERTY
100.0/ 100
METRIC RATING
12th/ 347
METRIC RANK
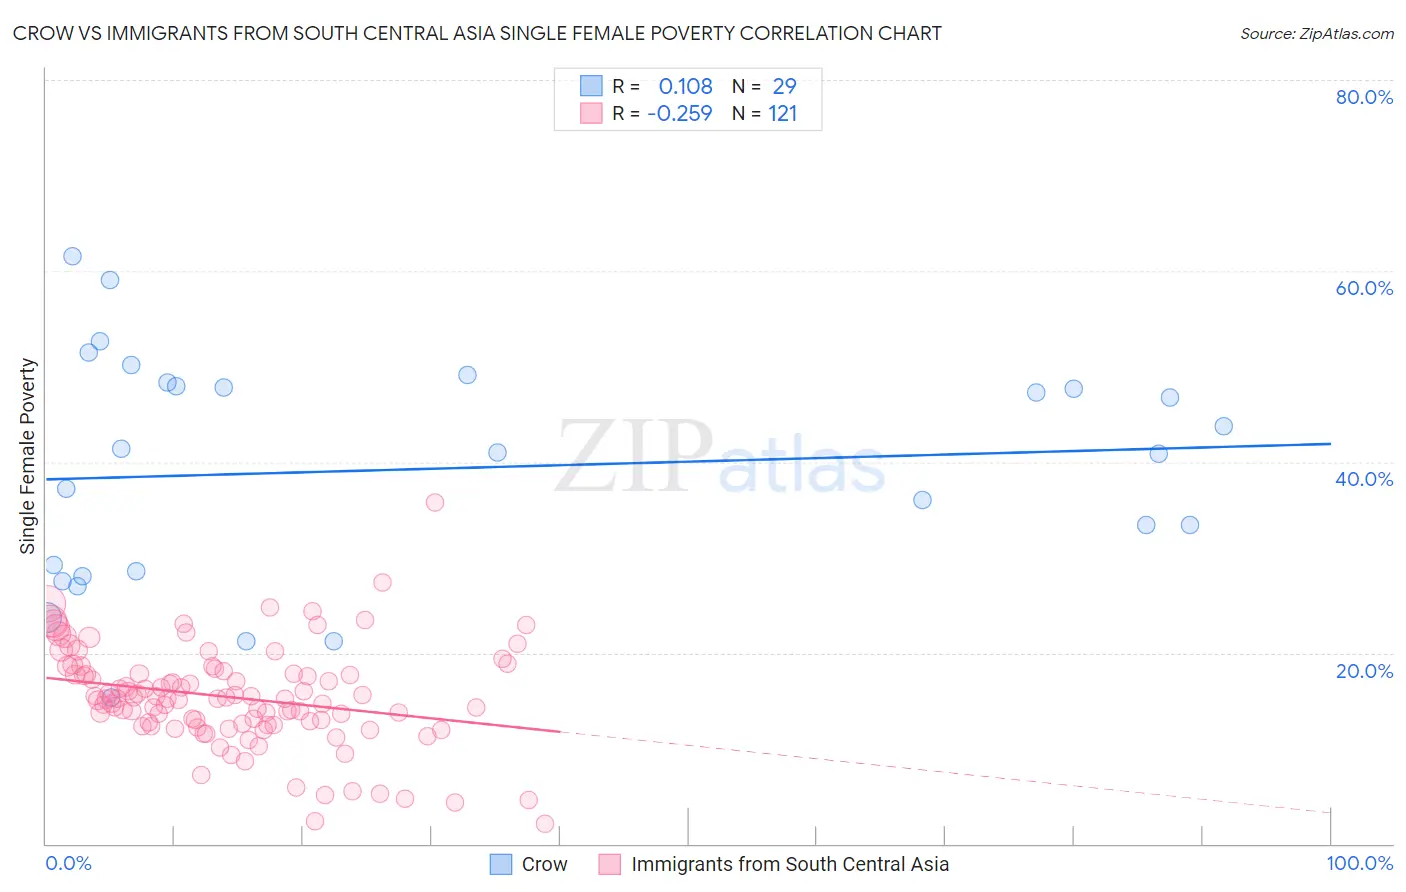
Crow vs Immigrants from South Central Asia Single Female Poverty Correlation Chart
The statistical analysis conducted on geographies consisting of 58,998,568 people shows a poor positive correlation between the proportion of Crow and poverty level among single females in the United States with a correlation coefficient (R) of 0.108 and weighted average of 32.4%. Similarly, the statistical analysis conducted on geographies consisting of 462,698,377 people shows a weak negative correlation between the proportion of Immigrants from South Central Asia and poverty level among single females in the United States with a correlation coefficient (R) of -0.259 and weighted average of 17.8%, a difference of 82.1%.
Single Female Poverty Correlation Summary
| Measurement | Crow | Immigrants from South Central Asia |
| Minimum | 15.4% | 2.0% |
| Maximum | 61.5% | 35.8% |
| Range | 46.1% | 33.8% |
| Mean | 39.3% | 15.4% |
| Median | 40.9% | 15.2% |
| Interquartile 25% (IQ1) | 28.3% | 12.5% |
| Interquartile 75% (IQ3) | 48.1% | 18.0% |
| Interquartile Range (IQR) | 19.8% | 5.4% |
| Standard Deviation (Sample) | 12.0% | 5.2% |
| Standard Deviation (Population) | 11.8% | 5.2% |
Similar Demographics by Single Female Poverty
Demographics Similar to Crow by Single Female Poverty
In terms of single female poverty, the demographic groups most similar to Crow are Lumbee (33.0%, a difference of 1.8%), Navajo (31.7%, a difference of 2.4%), Sioux (31.3%, a difference of 3.7%), Houma (33.8%, a difference of 4.3%), and Puerto Rican (34.1%, a difference of 5.2%).
| Demographics | Rating | Rank | Single Female Poverty |
| Ute | 0.0 /100 | #333 | Tragic 28.4% |
| Pueblo | 0.0 /100 | #334 | Tragic 28.6% |
| Immigrants | Yemen | 0.0 /100 | #335 | Tragic 28.9% |
| Colville | 0.0 /100 | #336 | Tragic 29.1% |
| Yuman | 0.0 /100 | #337 | Tragic 29.4% |
| Pima | 0.0 /100 | #338 | Tragic 30.3% |
| Cheyenne | 0.0 /100 | #339 | Tragic 30.4% |
| Cajuns | 0.0 /100 | #340 | Tragic 30.6% |
| Sioux | 0.0 /100 | #341 | Tragic 31.3% |
| Navajo | 0.0 /100 | #342 | Tragic 31.7% |
| Crow | 0.0 /100 | #343 | Tragic 32.4% |
| Lumbee | 0.0 /100 | #344 | Tragic 33.0% |
| Houma | 0.0 /100 | #345 | Tragic 33.8% |
| Puerto Ricans | 0.0 /100 | #346 | Tragic 34.1% |
| Tohono O'odham | 0.0 /100 | #347 | Tragic 34.2% |
Demographics Similar to Immigrants from South Central Asia by Single Female Poverty
In terms of single female poverty, the demographic groups most similar to Immigrants from South Central Asia are Immigrants from Lithuania (17.8%, a difference of 0.060%), Immigrants from Ireland (17.8%, a difference of 0.15%), Immigrants from Bolivia (17.8%, a difference of 0.26%), Bhutanese (17.7%, a difference of 0.56%), and Bolivian (17.9%, a difference of 0.70%).
| Demographics | Rating | Rank | Single Female Poverty |
| Assyrians/Chaldeans/Syriacs | 100.0 /100 | #5 | Exceptional 17.0% |
| Filipinos | 100.0 /100 | #6 | Exceptional 17.0% |
| Thais | 100.0 /100 | #7 | Exceptional 17.3% |
| Immigrants | Iran | 100.0 /100 | #8 | Exceptional 17.5% |
| Bhutanese | 100.0 /100 | #9 | Exceptional 17.7% |
| Immigrants | Ireland | 100.0 /100 | #10 | Exceptional 17.8% |
| Immigrants | Lithuania | 100.0 /100 | #11 | Exceptional 17.8% |
| Immigrants | South Central Asia | 100.0 /100 | #12 | Exceptional 17.8% |
| Immigrants | Bolivia | 100.0 /100 | #13 | Exceptional 17.8% |
| Bolivians | 100.0 /100 | #14 | Exceptional 17.9% |
| Indians (Asian) | 100.0 /100 | #15 | Exceptional 17.9% |
| Iranians | 100.0 /100 | #16 | Exceptional 18.0% |
| Immigrants | Korea | 100.0 /100 | #17 | Exceptional 18.1% |
| Immigrants | Eastern Asia | 100.0 /100 | #18 | Exceptional 18.1% |
| Immigrants | China | 100.0 /100 | #19 | Exceptional 18.1% |