Shoshone vs Hungarian Single Female Poverty
COMPARE
Shoshone
Hungarian
Single Female Poverty
Single Female Poverty Comparison
Shoshone
Hungarians
25.1%
SINGLE FEMALE POVERTY
0.0/ 100
METRIC RATING
302nd/ 347
METRIC RANK
21.1%
SINGLE FEMALE POVERTY
39.6/ 100
METRIC RATING
184th/ 347
METRIC RANK
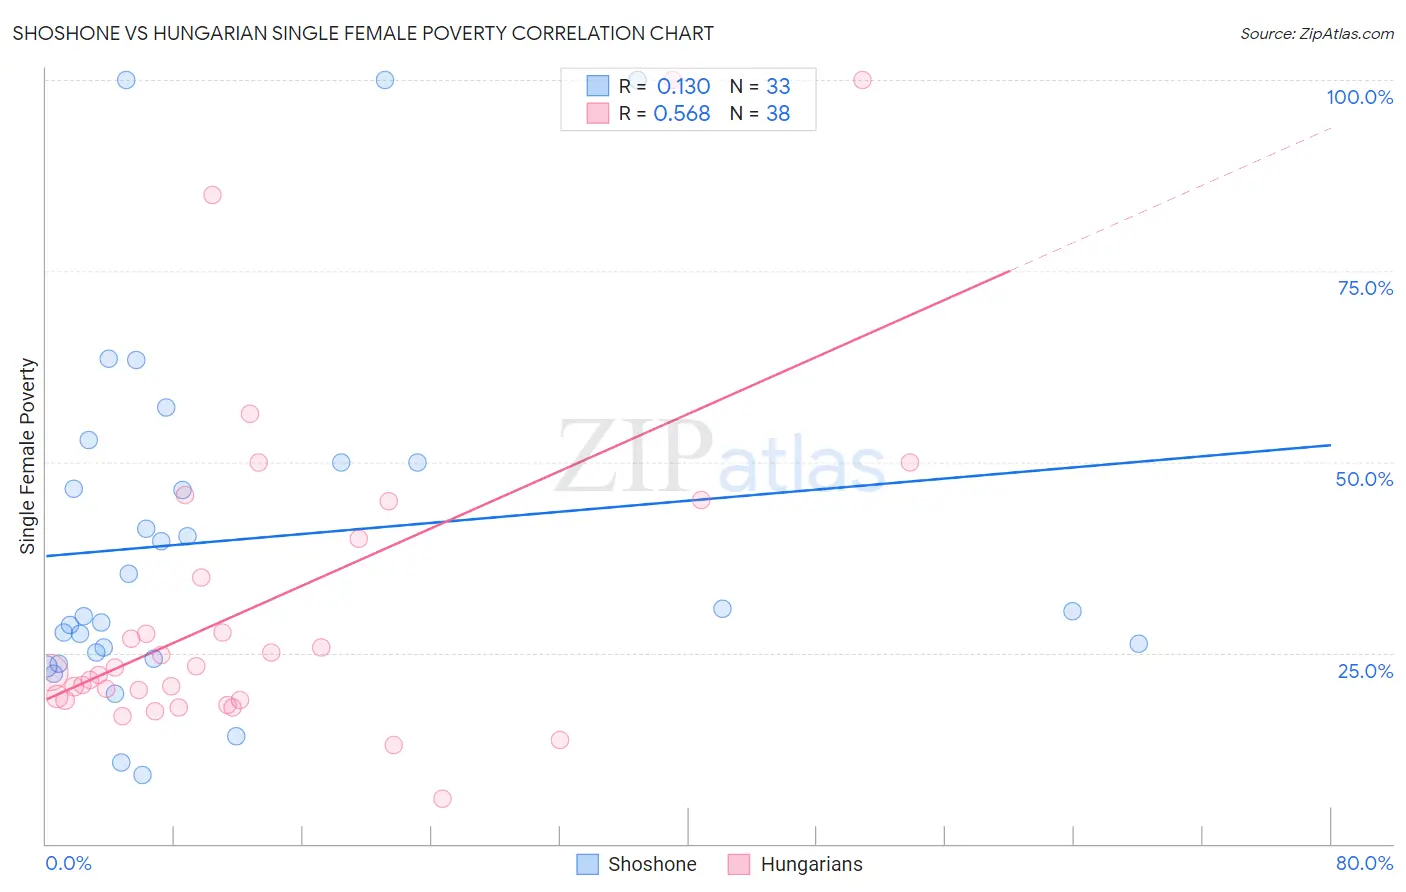
Shoshone vs Hungarian Single Female Poverty Correlation Chart
The statistical analysis conducted on geographies consisting of 66,449,019 people shows a poor positive correlation between the proportion of Shoshone and poverty level among single females in the United States with a correlation coefficient (R) of 0.130 and weighted average of 25.1%. Similarly, the statistical analysis conducted on geographies consisting of 473,502,236 people shows a substantial positive correlation between the proportion of Hungarians and poverty level among single females in the United States with a correlation coefficient (R) of 0.568 and weighted average of 21.1%, a difference of 18.8%.
Single Female Poverty Correlation Summary
| Measurement | Shoshone | Hungarian |
| Minimum | 9.1% | 6.0% |
| Maximum | 100.0% | 100.0% |
| Range | 90.9% | 94.0% |
| Mean | 39.8% | 31.6% |
| Median | 30.4% | 22.7% |
| Interquartile 25% (IQ1) | 24.6% | 18.9% |
| Interquartile 75% (IQ3) | 50.0% | 40.0% |
| Interquartile Range (IQR) | 25.4% | 21.1% |
| Standard Deviation (Sample) | 23.8% | 22.1% |
| Standard Deviation (Population) | 23.4% | 21.8% |
Similar Demographics by Single Female Poverty
Demographics Similar to Shoshone by Single Female Poverty
In terms of single female poverty, the demographic groups most similar to Shoshone are Honduran (25.1%, a difference of 0.090%), Blackfeet (25.1%, a difference of 0.26%), Mexican (25.0%, a difference of 0.34%), Somali (25.2%, a difference of 0.40%), and Immigrants from Congo (25.3%, a difference of 0.66%).
| Demographics | Rating | Rank | Single Female Poverty |
| Hispanics or Latinos | 0.0 /100 | #295 | Tragic 24.6% |
| Africans | 0.0 /100 | #296 | Tragic 24.8% |
| Immigrants | Central America | 0.0 /100 | #297 | Tragic 24.8% |
| Yaqui | 0.0 /100 | #298 | Tragic 24.9% |
| Mexicans | 0.0 /100 | #299 | Tragic 25.0% |
| Blackfeet | 0.0 /100 | #300 | Tragic 25.1% |
| Hondurans | 0.0 /100 | #301 | Tragic 25.1% |
| Shoshone | 0.0 /100 | #302 | Tragic 25.1% |
| Somalis | 0.0 /100 | #303 | Tragic 25.2% |
| Immigrants | Congo | 0.0 /100 | #304 | Tragic 25.3% |
| Immigrants | Dominican Republic | 0.0 /100 | #305 | Tragic 25.3% |
| Immigrants | Mexico | 0.0 /100 | #306 | Tragic 25.3% |
| Potawatomi | 0.0 /100 | #307 | Tragic 25.4% |
| Aleuts | 0.0 /100 | #308 | Tragic 25.4% |
| Dominicans | 0.0 /100 | #309 | Tragic 25.4% |
Demographics Similar to Hungarians by Single Female Poverty
In terms of single female poverty, the demographic groups most similar to Hungarians are Slovak (21.1%, a difference of 0.010%), Slavic (21.1%, a difference of 0.060%), Immigrants from Cambodia (21.2%, a difference of 0.090%), Hawaiian (21.2%, a difference of 0.13%), and Spanish American Indian (21.1%, a difference of 0.18%).
| Demographics | Rating | Rank | Single Female Poverty |
| Scandinavians | 45.2 /100 | #177 | Average 21.1% |
| Immigrants | Bosnia and Herzegovina | 44.9 /100 | #178 | Average 21.1% |
| British | 42.9 /100 | #179 | Average 21.1% |
| Spanish American Indians | 42.5 /100 | #180 | Average 21.1% |
| Europeans | 42.3 /100 | #181 | Average 21.1% |
| Slavs | 40.5 /100 | #182 | Average 21.1% |
| Slovaks | 39.7 /100 | #183 | Fair 21.1% |
| Hungarians | 39.6 /100 | #184 | Fair 21.1% |
| Immigrants | Cambodia | 38.2 /100 | #185 | Fair 21.2% |
| Hawaiians | 37.7 /100 | #186 | Fair 21.2% |
| Immigrants | Nigeria | 36.8 /100 | #187 | Fair 21.2% |
| Yugoslavians | 35.4 /100 | #188 | Fair 21.2% |
| Immigrants | Cuba | 35.3 /100 | #189 | Fair 21.2% |
| Trinidadians and Tobagonians | 35.2 /100 | #190 | Fair 21.2% |
| Immigrants | Germany | 31.1 /100 | #191 | Fair 21.3% |