Immigrants from Lithuania vs Hungarian Single Female Poverty
COMPARE
Immigrants from Lithuania
Hungarian
Single Female Poverty
Single Female Poverty Comparison
Immigrants from Lithuania
Hungarians
17.8%
SINGLE FEMALE POVERTY
100.0/ 100
METRIC RATING
11th/ 347
METRIC RANK
21.1%
SINGLE FEMALE POVERTY
39.6/ 100
METRIC RATING
184th/ 347
METRIC RANK
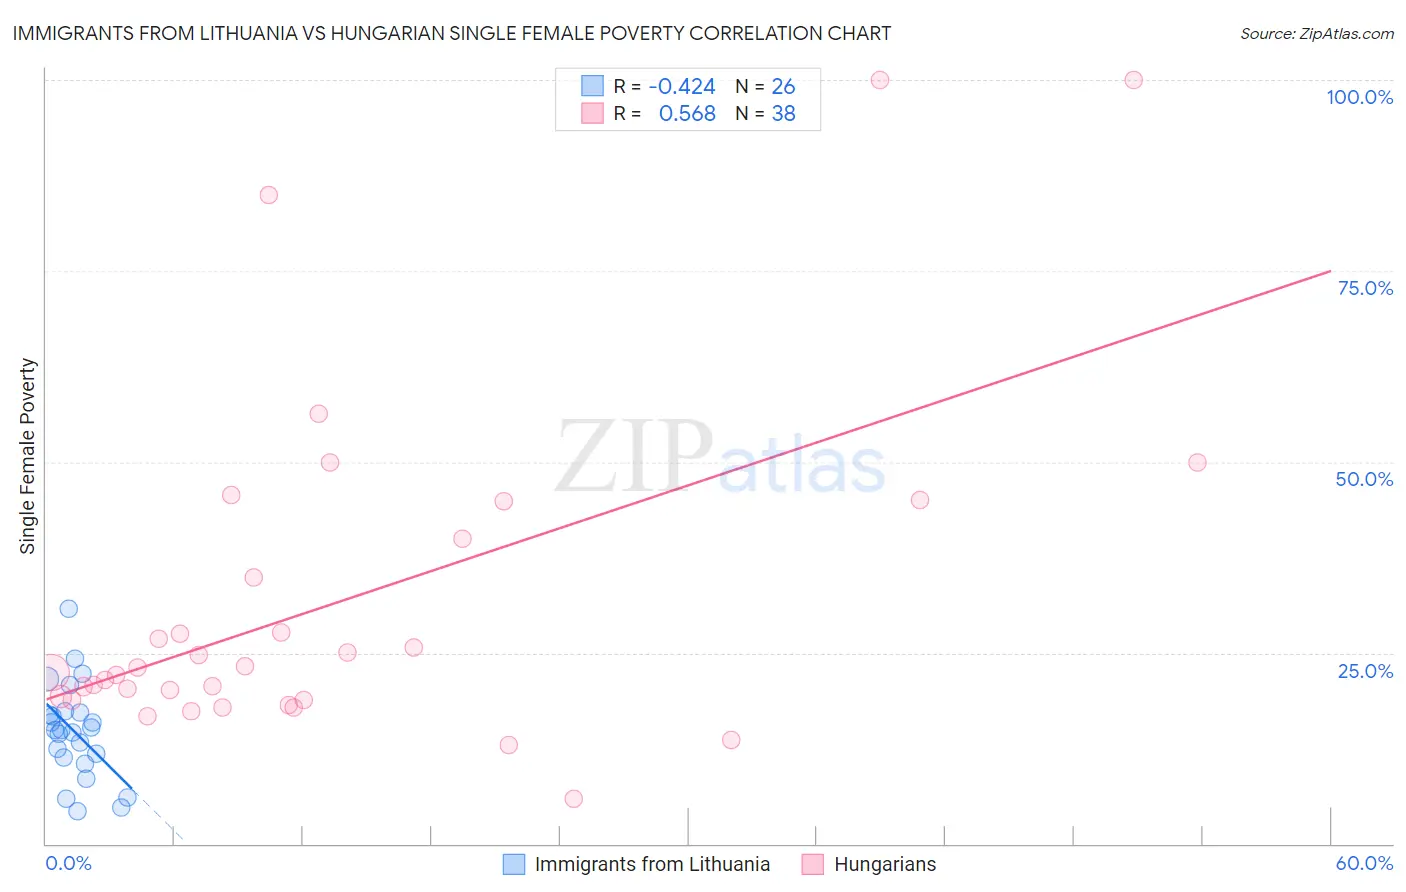
Immigrants from Lithuania vs Hungarian Single Female Poverty Correlation Chart
The statistical analysis conducted on geographies consisting of 116,892,262 people shows a moderate negative correlation between the proportion of Immigrants from Lithuania and poverty level among single females in the United States with a correlation coefficient (R) of -0.424 and weighted average of 17.8%. Similarly, the statistical analysis conducted on geographies consisting of 473,502,236 people shows a substantial positive correlation between the proportion of Hungarians and poverty level among single females in the United States with a correlation coefficient (R) of 0.568 and weighted average of 21.1%, a difference of 18.9%.
Single Female Poverty Correlation Summary
| Measurement | Immigrants from Lithuania | Hungarian |
| Minimum | 4.2% | 6.0% |
| Maximum | 30.7% | 100.0% |
| Range | 26.6% | 94.0% |
| Mean | 14.7% | 31.6% |
| Median | 14.9% | 22.7% |
| Interquartile 25% (IQ1) | 11.3% | 18.9% |
| Interquartile 75% (IQ3) | 17.2% | 40.0% |
| Interquartile Range (IQR) | 6.0% | 21.1% |
| Standard Deviation (Sample) | 6.2% | 22.1% |
| Standard Deviation (Population) | 6.1% | 21.8% |
Similar Demographics by Single Female Poverty
Demographics Similar to Immigrants from Lithuania by Single Female Poverty
In terms of single female poverty, the demographic groups most similar to Immigrants from Lithuania are Immigrants from South Central Asia (17.8%, a difference of 0.060%), Immigrants from Ireland (17.8%, a difference of 0.090%), Immigrants from Bolivia (17.8%, a difference of 0.32%), Bhutanese (17.7%, a difference of 0.50%), and Bolivian (17.9%, a difference of 0.76%).
| Demographics | Rating | Rank | Single Female Poverty |
| Immigrants | India | 100.0 /100 | #4 | Exceptional 16.8% |
| Assyrians/Chaldeans/Syriacs | 100.0 /100 | #5 | Exceptional 17.0% |
| Filipinos | 100.0 /100 | #6 | Exceptional 17.0% |
| Thais | 100.0 /100 | #7 | Exceptional 17.3% |
| Immigrants | Iran | 100.0 /100 | #8 | Exceptional 17.5% |
| Bhutanese | 100.0 /100 | #9 | Exceptional 17.7% |
| Immigrants | Ireland | 100.0 /100 | #10 | Exceptional 17.8% |
| Immigrants | Lithuania | 100.0 /100 | #11 | Exceptional 17.8% |
| Immigrants | South Central Asia | 100.0 /100 | #12 | Exceptional 17.8% |
| Immigrants | Bolivia | 100.0 /100 | #13 | Exceptional 17.8% |
| Bolivians | 100.0 /100 | #14 | Exceptional 17.9% |
| Indians (Asian) | 100.0 /100 | #15 | Exceptional 17.9% |
| Iranians | 100.0 /100 | #16 | Exceptional 18.0% |
| Immigrants | Korea | 100.0 /100 | #17 | Exceptional 18.1% |
| Immigrants | Eastern Asia | 100.0 /100 | #18 | Exceptional 18.1% |
Demographics Similar to Hungarians by Single Female Poverty
In terms of single female poverty, the demographic groups most similar to Hungarians are Slovak (21.1%, a difference of 0.010%), Slavic (21.1%, a difference of 0.060%), Immigrants from Cambodia (21.2%, a difference of 0.090%), Hawaiian (21.2%, a difference of 0.13%), and Spanish American Indian (21.1%, a difference of 0.18%).
| Demographics | Rating | Rank | Single Female Poverty |
| Scandinavians | 45.2 /100 | #177 | Average 21.1% |
| Immigrants | Bosnia and Herzegovina | 44.9 /100 | #178 | Average 21.1% |
| British | 42.9 /100 | #179 | Average 21.1% |
| Spanish American Indians | 42.5 /100 | #180 | Average 21.1% |
| Europeans | 42.3 /100 | #181 | Average 21.1% |
| Slavs | 40.5 /100 | #182 | Average 21.1% |
| Slovaks | 39.7 /100 | #183 | Fair 21.1% |
| Hungarians | 39.6 /100 | #184 | Fair 21.1% |
| Immigrants | Cambodia | 38.2 /100 | #185 | Fair 21.2% |
| Hawaiians | 37.7 /100 | #186 | Fair 21.2% |
| Immigrants | Nigeria | 36.8 /100 | #187 | Fair 21.2% |
| Yugoslavians | 35.4 /100 | #188 | Fair 21.2% |
| Immigrants | Cuba | 35.3 /100 | #189 | Fair 21.2% |
| Trinidadians and Tobagonians | 35.2 /100 | #190 | Fair 21.2% |
| Immigrants | Germany | 31.1 /100 | #191 | Fair 21.3% |