Cree vs Trinidadian and Tobagonian Family Households
COMPARE
Cree
Trinidadian and Tobagonian
Family Households
Family Households Comparison
Cree
Trinidadians and Tobagonians
62.3%
FAMILY HOUSEHOLDS
0.0/ 100
METRIC RATING
303rd/ 347
METRIC RANK
63.6%
FAMILY HOUSEHOLDS
4.1/ 100
METRIC RATING
227th/ 347
METRIC RANK
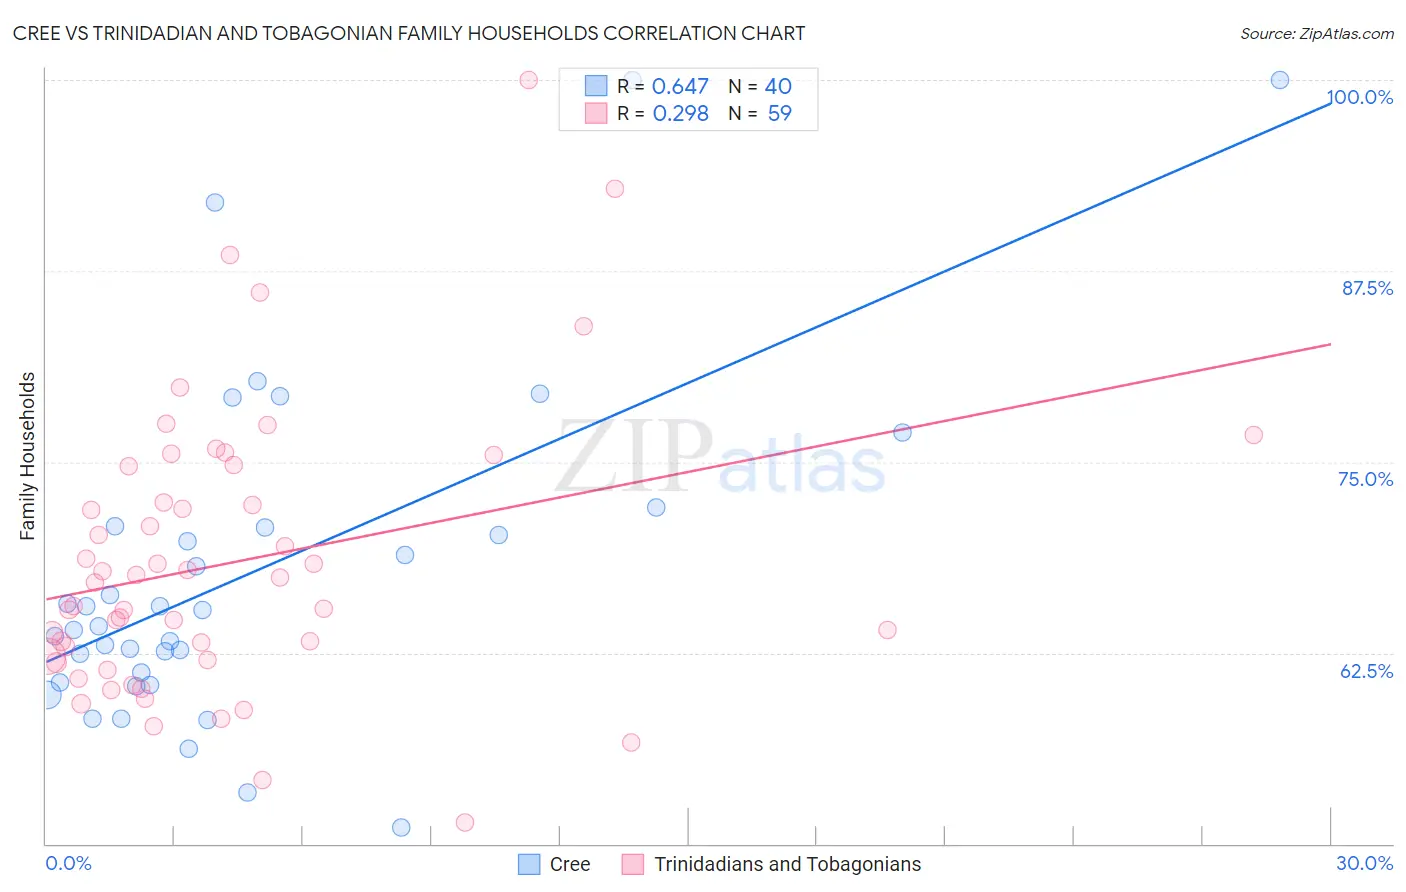
Cree vs Trinidadian and Tobagonian Family Households Correlation Chart
The statistical analysis conducted on geographies consisting of 76,210,457 people shows a significant positive correlation between the proportion of Cree and percentage of family households in the United States with a correlation coefficient (R) of 0.647 and weighted average of 62.3%. Similarly, the statistical analysis conducted on geographies consisting of 219,716,618 people shows a weak positive correlation between the proportion of Trinidadians and Tobagonians and percentage of family households in the United States with a correlation coefficient (R) of 0.298 and weighted average of 63.6%, a difference of 2.1%.
Family Households Correlation Summary
| Measurement | Cree | Trinidadian and Tobagonian |
| Minimum | 51.1% | 51.4% |
| Maximum | 100.0% | 100.0% |
| Range | 48.9% | 48.6% |
| Mean | 67.8% | 68.4% |
| Median | 64.8% | 67.1% |
| Interquartile 25% (IQ1) | 60.9% | 62.1% |
| Interquartile 75% (IQ3) | 70.7% | 74.7% |
| Interquartile Range (IQR) | 9.9% | 12.7% |
| Standard Deviation (Sample) | 11.0% | 9.3% |
| Standard Deviation (Population) | 10.9% | 9.2% |
Similar Demographics by Family Households
Demographics Similar to Cree by Family Households
In terms of family households, the demographic groups most similar to Cree are Immigrants from Kenya (62.3%, a difference of 0.060%), Immigrants from Albania (62.4%, a difference of 0.10%), Iroquois (62.2%, a difference of 0.10%), Immigrants from Kuwait (62.4%, a difference of 0.12%), and Immigrants from Africa (62.4%, a difference of 0.12%).
| Demographics | Rating | Rank | Family Households |
| Slovenes | 0.0 /100 | #296 | Tragic 62.4% |
| French American Indians | 0.0 /100 | #297 | Tragic 62.4% |
| Immigrants | Spain | 0.0 /100 | #298 | Tragic 62.4% |
| Immigrants | Kuwait | 0.0 /100 | #299 | Tragic 62.4% |
| Immigrants | Africa | 0.0 /100 | #300 | Tragic 62.4% |
| Immigrants | Albania | 0.0 /100 | #301 | Tragic 62.4% |
| Immigrants | Kenya | 0.0 /100 | #302 | Tragic 62.3% |
| Cree | 0.0 /100 | #303 | Tragic 62.3% |
| Iroquois | 0.0 /100 | #304 | Tragic 62.2% |
| Bermudans | 0.0 /100 | #305 | Tragic 62.2% |
| Africans | 0.0 /100 | #306 | Tragic 62.1% |
| Immigrants | Norway | 0.0 /100 | #307 | Tragic 62.1% |
| Chippewa | 0.0 /100 | #308 | Tragic 62.1% |
| Sub-Saharan Africans | 0.0 /100 | #309 | Tragic 62.1% |
| Immigrants | Liberia | 0.0 /100 | #310 | Tragic 62.0% |
Demographics Similar to Trinidadians and Tobagonians by Family Households
In terms of family households, the demographic groups most similar to Trinidadians and Tobagonians are Immigrants from Bahamas (63.6%, a difference of 0.010%), Immigrants from Hungary (63.6%, a difference of 0.020%), Turkish (63.6%, a difference of 0.030%), Blackfeet (63.6%, a difference of 0.050%), and Bulgarian (63.6%, a difference of 0.070%).
| Demographics | Rating | Rank | Family Households |
| Immigrants | Europe | 6.4 /100 | #220 | Tragic 63.7% |
| Immigrants | South Africa | 5.9 /100 | #221 | Tragic 63.7% |
| Immigrants | Belarus | 5.5 /100 | #222 | Tragic 63.7% |
| French Canadians | 5.4 /100 | #223 | Tragic 63.7% |
| Turks | 4.5 /100 | #224 | Tragic 63.6% |
| Immigrants | Hungary | 4.3 /100 | #225 | Tragic 63.6% |
| Immigrants | Bahamas | 4.2 /100 | #226 | Tragic 63.6% |
| Trinidadians and Tobagonians | 4.1 /100 | #227 | Tragic 63.6% |
| Blackfeet | 3.6 /100 | #228 | Tragic 63.6% |
| Bulgarians | 3.4 /100 | #229 | Tragic 63.6% |
| Immigrants | Brazil | 3.0 /100 | #230 | Tragic 63.6% |
| Immigrants | Greece | 2.9 /100 | #231 | Tragic 63.5% |
| Immigrants | Northern Africa | 2.6 /100 | #232 | Tragic 63.5% |
| Immigrants | Armenia | 2.6 /100 | #233 | Tragic 63.5% |
| Finns | 2.3 /100 | #234 | Tragic 63.5% |