Cree vs Bermudan Family Poverty
COMPARE
Cree
Bermudan
Family Poverty
Family Poverty Comparison
Cree
Bermudans
10.5%
FAMILY POVERTY
0.7/ 100
METRIC RATING
244th/ 347
METRIC RANK
9.9%
FAMILY POVERTY
5.3/ 100
METRIC RATING
220th/ 347
METRIC RANK
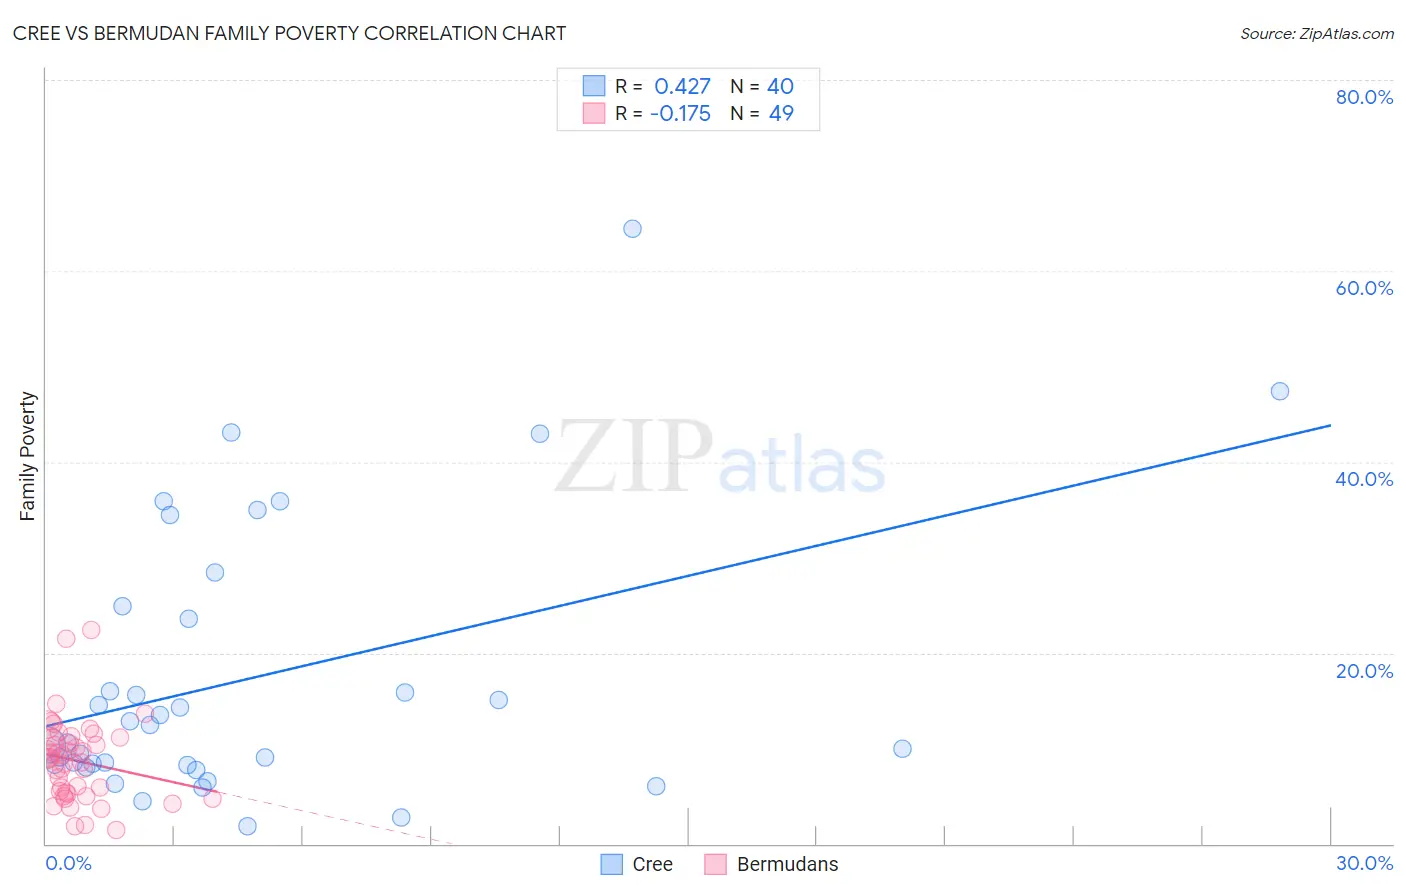
Cree vs Bermudan Family Poverty Correlation Chart
The statistical analysis conducted on geographies consisting of 76,172,191 people shows a moderate positive correlation between the proportion of Cree and poverty level among families in the United States with a correlation coefficient (R) of 0.427 and weighted average of 10.5%. Similarly, the statistical analysis conducted on geographies consisting of 55,709,742 people shows a poor negative correlation between the proportion of Bermudans and poverty level among families in the United States with a correlation coefficient (R) of -0.175 and weighted average of 9.9%, a difference of 6.2%.
Family Poverty Correlation Summary
| Measurement | Cree | Bermudan |
| Minimum | 1.8% | 1.5% |
| Maximum | 64.4% | 22.4% |
| Range | 62.6% | 20.8% |
| Mean | 17.4% | 8.7% |
| Median | 11.6% | 9.0% |
| Interquartile 25% (IQ1) | 8.3% | 5.3% |
| Interquartile 75% (IQ3) | 24.2% | 11.1% |
| Interquartile Range (IQR) | 16.0% | 5.8% |
| Standard Deviation (Sample) | 14.4% | 4.3% |
| Standard Deviation (Population) | 14.2% | 4.2% |
Similar Demographics by Family Poverty
Demographics Similar to Cree by Family Poverty
In terms of family poverty, the demographic groups most similar to Cree are Nepalese (10.4%, a difference of 0.46%), Immigrants from Burma/Myanmar (10.5%, a difference of 0.61%), Alaska Native (10.4%, a difference of 0.94%), Cherokee (10.6%, a difference of 1.3%), and Liberian (10.6%, a difference of 1.3%).
| Demographics | Rating | Rank | Family Poverty |
| Immigrants | Laos | 1.7 /100 | #237 | Tragic 10.2% |
| French American Indians | 1.5 /100 | #238 | Tragic 10.2% |
| Potawatomi | 1.5 /100 | #239 | Tragic 10.2% |
| Immigrants | Azores | 1.4 /100 | #240 | Tragic 10.3% |
| Ghanaians | 1.3 /100 | #241 | Tragic 10.3% |
| Alaska Natives | 1.0 /100 | #242 | Tragic 10.4% |
| Nepalese | 0.8 /100 | #243 | Tragic 10.4% |
| Cree | 0.7 /100 | #244 | Tragic 10.5% |
| Immigrants | Burma/Myanmar | 0.6 /100 | #245 | Tragic 10.5% |
| Cherokee | 0.5 /100 | #246 | Tragic 10.6% |
| Liberians | 0.4 /100 | #247 | Tragic 10.6% |
| Nicaraguans | 0.4 /100 | #248 | Tragic 10.6% |
| Cubans | 0.4 /100 | #249 | Tragic 10.6% |
| Salvadorans | 0.3 /100 | #250 | Tragic 10.7% |
| Iroquois | 0.3 /100 | #251 | Tragic 10.7% |
Demographics Similar to Bermudans by Family Poverty
In terms of family poverty, the demographic groups most similar to Bermudans are Immigrants from Eritrea (9.9%, a difference of 0.060%), Panamanian (9.8%, a difference of 0.18%), Immigrants from Cambodia (9.9%, a difference of 0.27%), Japanese (9.9%, a difference of 0.31%), and American (9.8%, a difference of 0.50%).
| Demographics | Rating | Rank | Family Poverty |
| Osage | 8.0 /100 | #213 | Tragic 9.7% |
| Immigrants | Micronesia | 6.7 /100 | #214 | Tragic 9.8% |
| Immigrants | Nonimmigrants | 6.7 /100 | #215 | Tragic 9.8% |
| Moroccans | 6.5 /100 | #216 | Tragic 9.8% |
| Americans | 6.2 /100 | #217 | Tragic 9.8% |
| Panamanians | 5.6 /100 | #218 | Tragic 9.8% |
| Immigrants | Eritrea | 5.4 /100 | #219 | Tragic 9.9% |
| Bermudans | 5.3 /100 | #220 | Tragic 9.9% |
| Immigrants | Cambodia | 4.8 /100 | #221 | Tragic 9.9% |
| Japanese | 4.8 /100 | #222 | Tragic 9.9% |
| Immigrants | Africa | 4.3 /100 | #223 | Tragic 9.9% |
| Marshallese | 3.9 /100 | #224 | Tragic 9.9% |
| Immigrants | Immigrants | 3.6 /100 | #225 | Tragic 10.0% |
| Ottawa | 3.3 /100 | #226 | Tragic 10.0% |
| Immigrants | Armenia | 3.3 /100 | #227 | Tragic 10.0% |