Cree vs Lithuanian Family Poverty
COMPARE
Cree
Lithuanian
Family Poverty
Family Poverty Comparison
Cree
Lithuanians
10.5%
FAMILY POVERTY
0.7/ 100
METRIC RATING
244th/ 347
METRIC RANK
7.2%
FAMILY POVERTY
99.8/ 100
METRIC RATING
15th/ 347
METRIC RANK
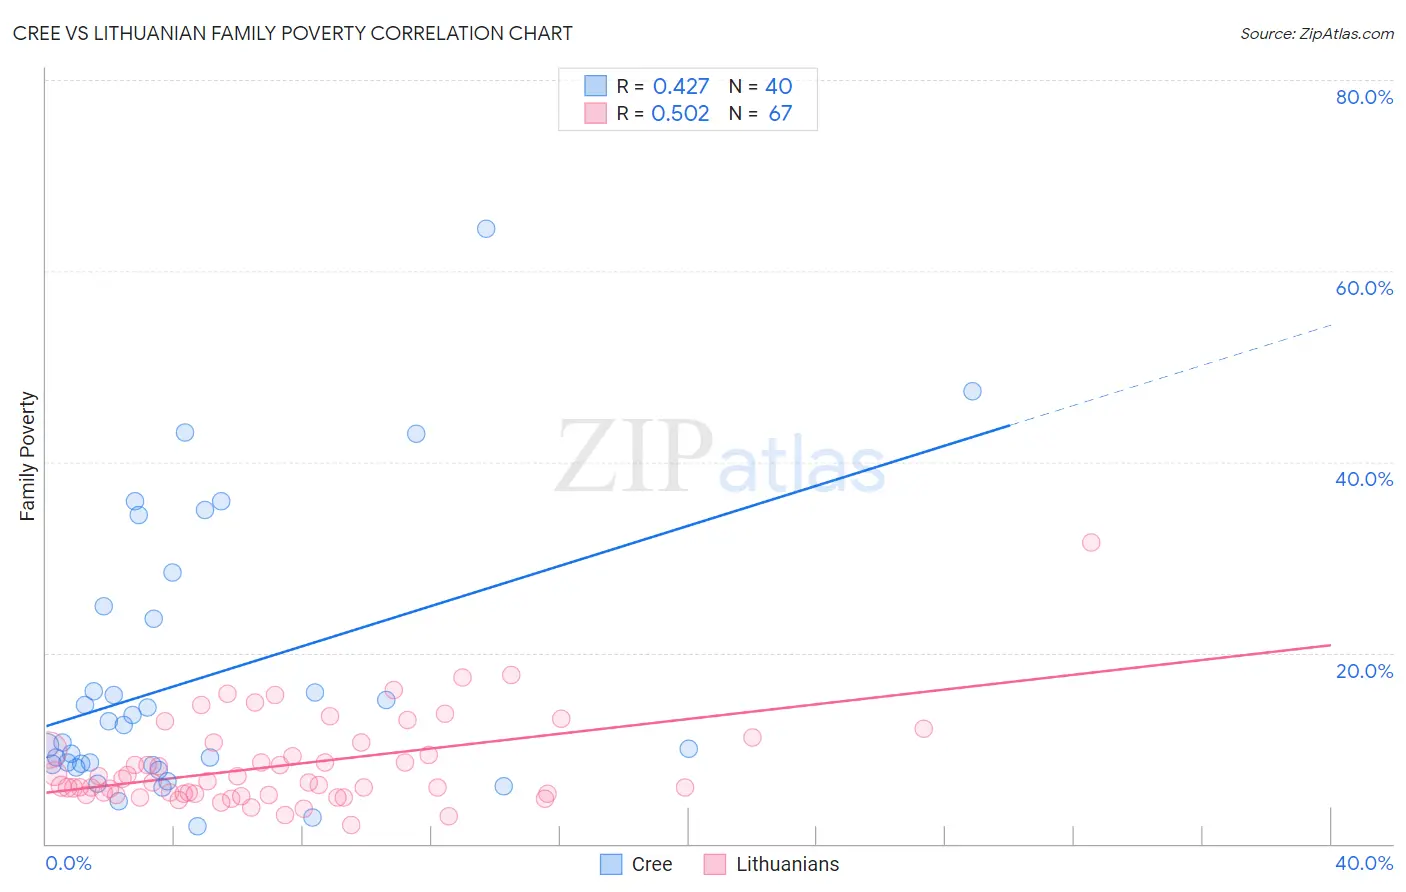
Cree vs Lithuanian Family Poverty Correlation Chart
The statistical analysis conducted on geographies consisting of 76,172,191 people shows a moderate positive correlation between the proportion of Cree and poverty level among families in the United States with a correlation coefficient (R) of 0.427 and weighted average of 10.5%. Similarly, the statistical analysis conducted on geographies consisting of 420,202,329 people shows a substantial positive correlation between the proportion of Lithuanians and poverty level among families in the United States with a correlation coefficient (R) of 0.502 and weighted average of 7.2%, a difference of 45.7%.
Family Poverty Correlation Summary
| Measurement | Cree | Lithuanian |
| Minimum | 1.8% | 2.0% |
| Maximum | 64.4% | 31.6% |
| Range | 62.6% | 29.6% |
| Mean | 17.4% | 8.3% |
| Median | 11.6% | 6.4% |
| Interquartile 25% (IQ1) | 8.3% | 5.2% |
| Interquartile 75% (IQ3) | 24.2% | 10.5% |
| Interquartile Range (IQR) | 16.0% | 5.3% |
| Standard Deviation (Sample) | 14.4% | 4.8% |
| Standard Deviation (Population) | 14.2% | 4.8% |
Similar Demographics by Family Poverty
Demographics Similar to Cree by Family Poverty
In terms of family poverty, the demographic groups most similar to Cree are Nepalese (10.4%, a difference of 0.46%), Immigrants from Burma/Myanmar (10.5%, a difference of 0.61%), Alaska Native (10.4%, a difference of 0.94%), Cherokee (10.6%, a difference of 1.3%), and Liberian (10.6%, a difference of 1.3%).
| Demographics | Rating | Rank | Family Poverty |
| Immigrants | Laos | 1.7 /100 | #237 | Tragic 10.2% |
| French American Indians | 1.5 /100 | #238 | Tragic 10.2% |
| Potawatomi | 1.5 /100 | #239 | Tragic 10.2% |
| Immigrants | Azores | 1.4 /100 | #240 | Tragic 10.3% |
| Ghanaians | 1.3 /100 | #241 | Tragic 10.3% |
| Alaska Natives | 1.0 /100 | #242 | Tragic 10.4% |
| Nepalese | 0.8 /100 | #243 | Tragic 10.4% |
| Cree | 0.7 /100 | #244 | Tragic 10.5% |
| Immigrants | Burma/Myanmar | 0.6 /100 | #245 | Tragic 10.5% |
| Cherokee | 0.5 /100 | #246 | Tragic 10.6% |
| Liberians | 0.4 /100 | #247 | Tragic 10.6% |
| Nicaraguans | 0.4 /100 | #248 | Tragic 10.6% |
| Cubans | 0.4 /100 | #249 | Tragic 10.6% |
| Salvadorans | 0.3 /100 | #250 | Tragic 10.7% |
| Iroquois | 0.3 /100 | #251 | Tragic 10.7% |
Demographics Similar to Lithuanians by Family Poverty
In terms of family poverty, the demographic groups most similar to Lithuanians are Immigrants from South Central Asia (7.2%, a difference of 0.27%), Luxembourger (7.2%, a difference of 0.50%), Immigrants from Lithuania (7.2%, a difference of 0.51%), Eastern European (7.2%, a difference of 0.81%), and Swedish (7.1%, a difference of 0.88%).
| Demographics | Rating | Rank | Family Poverty |
| Bhutanese | 99.9 /100 | #8 | Exceptional 7.0% |
| Latvians | 99.9 /100 | #9 | Exceptional 7.1% |
| Bulgarians | 99.8 /100 | #10 | Exceptional 7.1% |
| Immigrants | Singapore | 99.8 /100 | #11 | Exceptional 7.1% |
| Maltese | 99.8 /100 | #12 | Exceptional 7.1% |
| Swedes | 99.8 /100 | #13 | Exceptional 7.1% |
| Iranians | 99.8 /100 | #14 | Exceptional 7.1% |
| Lithuanians | 99.8 /100 | #15 | Exceptional 7.2% |
| Immigrants | South Central Asia | 99.8 /100 | #16 | Exceptional 7.2% |
| Luxembourgers | 99.8 /100 | #17 | Exceptional 7.2% |
| Immigrants | Lithuania | 99.8 /100 | #18 | Exceptional 7.2% |
| Eastern Europeans | 99.7 /100 | #19 | Exceptional 7.2% |
| Immigrants | Hong Kong | 99.7 /100 | #20 | Exceptional 7.3% |
| Immigrants | Iran | 99.7 /100 | #21 | Exceptional 7.3% |
| Danes | 99.7 /100 | #22 | Exceptional 7.3% |