Burmese vs Immigrants from Eritrea Single Female Poverty
COMPARE
Burmese
Immigrants from Eritrea
Single Female Poverty
Single Female Poverty Comparison
Burmese
Immigrants from Eritrea
18.3%
SINGLE FEMALE POVERTY
100.0/ 100
METRIC RATING
22nd/ 347
METRIC RANK
21.8%
SINGLE FEMALE POVERTY
7.9/ 100
METRIC RATING
222nd/ 347
METRIC RANK
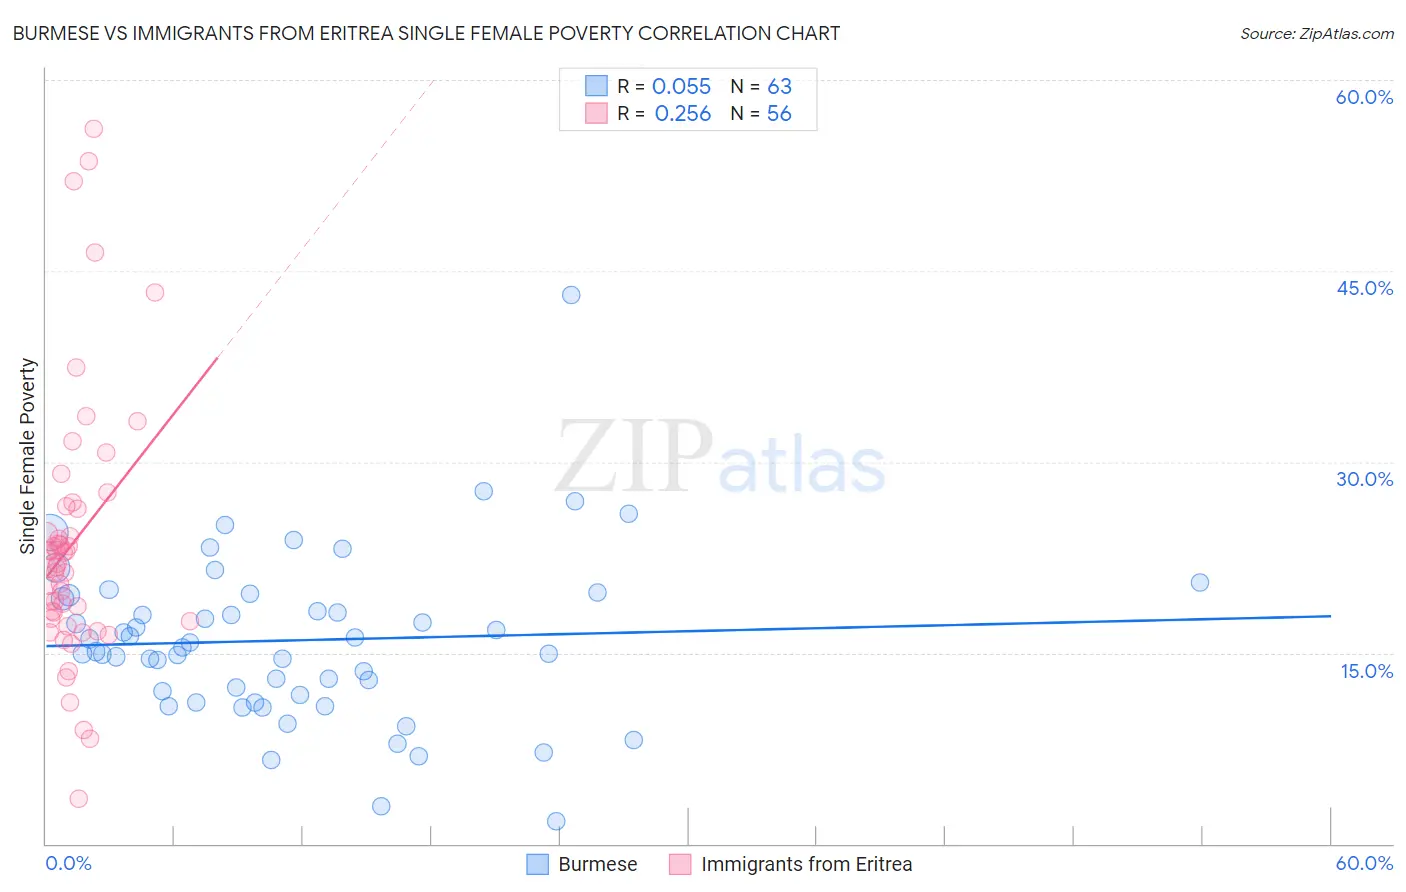
Burmese vs Immigrants from Eritrea Single Female Poverty Correlation Chart
The statistical analysis conducted on geographies consisting of 455,450,200 people shows a slight positive correlation between the proportion of Burmese and poverty level among single females in the United States with a correlation coefficient (R) of 0.055 and weighted average of 18.3%. Similarly, the statistical analysis conducted on geographies consisting of 104,658,207 people shows a weak positive correlation between the proportion of Immigrants from Eritrea and poverty level among single females in the United States with a correlation coefficient (R) of 0.256 and weighted average of 21.8%, a difference of 19.3%.
Single Female Poverty Correlation Summary
| Measurement | Burmese | Immigrants from Eritrea |
| Minimum | 1.8% | 3.5% |
| Maximum | 43.2% | 56.2% |
| Range | 41.3% | 52.6% |
| Mean | 16.0% | 23.7% |
| Median | 15.4% | 21.8% |
| Interquartile 25% (IQ1) | 11.7% | 17.6% |
| Interquartile 75% (IQ3) | 19.5% | 26.4% |
| Interquartile Range (IQR) | 7.9% | 8.8% |
| Standard Deviation (Sample) | 6.6% | 10.5% |
| Standard Deviation (Population) | 6.5% | 10.4% |
Similar Demographics by Single Female Poverty
Demographics Similar to Burmese by Single Female Poverty
In terms of single female poverty, the demographic groups most similar to Burmese are Asian (18.3%, a difference of 0.0%), Maltese (18.3%, a difference of 0.010%), Immigrants from Greece (18.3%, a difference of 0.070%), Armenian (18.3%, a difference of 0.23%), and Immigrants from Singapore (18.3%, a difference of 0.33%).
| Demographics | Rating | Rank | Single Female Poverty |
| Indians (Asian) | 100.0 /100 | #15 | Exceptional 17.9% |
| Iranians | 100.0 /100 | #16 | Exceptional 18.0% |
| Immigrants | Korea | 100.0 /100 | #17 | Exceptional 18.1% |
| Immigrants | Eastern Asia | 100.0 /100 | #18 | Exceptional 18.1% |
| Immigrants | China | 100.0 /100 | #19 | Exceptional 18.1% |
| Immigrants | Greece | 100.0 /100 | #20 | Exceptional 18.3% |
| Maltese | 100.0 /100 | #21 | Exceptional 18.3% |
| Burmese | 100.0 /100 | #22 | Exceptional 18.3% |
| Asians | 100.0 /100 | #23 | Exceptional 18.3% |
| Armenians | 100.0 /100 | #24 | Exceptional 18.3% |
| Immigrants | Singapore | 100.0 /100 | #25 | Exceptional 18.3% |
| Immigrants | Israel | 100.0 /100 | #26 | Exceptional 18.3% |
| Immigrants | Pakistan | 100.0 /100 | #27 | Exceptional 18.4% |
| Immigrants | Moldova | 100.0 /100 | #28 | Exceptional 18.5% |
| Immigrants | Poland | 100.0 /100 | #29 | Exceptional 18.5% |
Demographics Similar to Immigrants from Eritrea by Single Female Poverty
In terms of single female poverty, the demographic groups most similar to Immigrants from Eritrea are Immigrants from Grenada (21.8%, a difference of 0.010%), German (21.8%, a difference of 0.070%), Scottish (21.8%, a difference of 0.14%), Barbadian (21.8%, a difference of 0.16%), and Panamanian (21.7%, a difference of 0.27%).
| Demographics | Rating | Rank | Single Female Poverty |
| Ecuadorians | 12.3 /100 | #215 | Poor 21.6% |
| Immigrants | Barbados | 12.2 /100 | #216 | Poor 21.7% |
| Immigrants | St. Vincent and the Grenadines | 11.7 /100 | #217 | Poor 21.7% |
| Nepalese | 9.7 /100 | #218 | Tragic 21.7% |
| Panamanians | 9.4 /100 | #219 | Tragic 21.7% |
| Germans | 8.3 /100 | #220 | Tragic 21.8% |
| Immigrants | Grenada | 8.0 /100 | #221 | Tragic 21.8% |
| Immigrants | Eritrea | 7.9 /100 | #222 | Tragic 21.8% |
| Scottish | 7.3 /100 | #223 | Tragic 21.8% |
| Barbadians | 7.2 /100 | #224 | Tragic 21.8% |
| English | 6.4 /100 | #225 | Tragic 21.9% |
| Immigrants | Portugal | 5.8 /100 | #226 | Tragic 21.9% |
| Immigrants | Ghana | 5.8 /100 | #227 | Tragic 21.9% |
| Salvadorans | 5.5 /100 | #228 | Tragic 21.9% |
| Tlingit-Haida | 5.4 /100 | #229 | Tragic 21.9% |