Malaysian vs Immigrants from Eritrea Single Female Poverty
COMPARE
Malaysian
Immigrants from Eritrea
Single Female Poverty
Single Female Poverty Comparison
Malaysians
Immigrants from Eritrea
22.2%
SINGLE FEMALE POVERTY
2.8/ 100
METRIC RATING
239th/ 347
METRIC RANK
21.8%
SINGLE FEMALE POVERTY
7.9/ 100
METRIC RATING
222nd/ 347
METRIC RANK
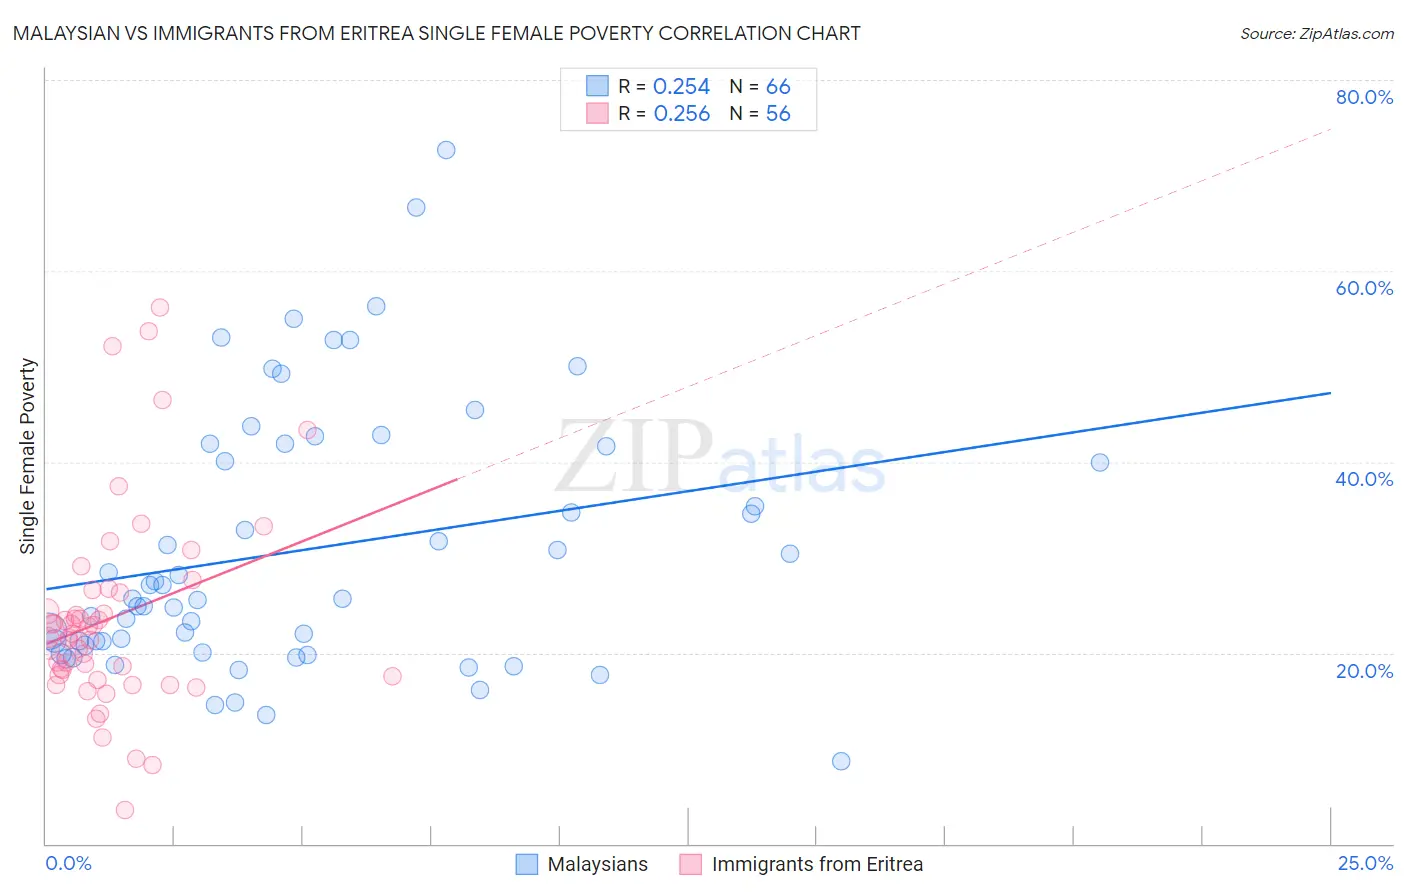
Malaysian vs Immigrants from Eritrea Single Female Poverty Correlation Chart
The statistical analysis conducted on geographies consisting of 224,481,570 people shows a weak positive correlation between the proportion of Malaysians and poverty level among single females in the United States with a correlation coefficient (R) of 0.254 and weighted average of 22.2%. Similarly, the statistical analysis conducted on geographies consisting of 104,658,207 people shows a weak positive correlation between the proportion of Immigrants from Eritrea and poverty level among single females in the United States with a correlation coefficient (R) of 0.256 and weighted average of 21.8%, a difference of 1.7%.
Single Female Poverty Correlation Summary
| Measurement | Malaysian | Immigrants from Eritrea |
| Minimum | 8.7% | 3.5% |
| Maximum | 72.7% | 56.2% |
| Range | 64.0% | 52.6% |
| Mean | 30.8% | 23.7% |
| Median | 25.6% | 21.8% |
| Interquartile 25% (IQ1) | 20.8% | 17.6% |
| Interquartile 75% (IQ3) | 41.7% | 26.4% |
| Interquartile Range (IQR) | 20.9% | 8.8% |
| Standard Deviation (Sample) | 13.7% | 10.5% |
| Standard Deviation (Population) | 13.6% | 10.4% |
Demographics Similar to Malaysians and Immigrants from Eritrea by Single Female Poverty
In terms of single female poverty, the demographic groups most similar to Malaysians are French Canadian (22.2%, a difference of 0.0%), French (22.2%, a difference of 0.26%), Vietnamese (22.0%, a difference of 0.56%), Immigrants from Ecuador (22.0%, a difference of 0.63%), and Dutch (22.0%, a difference of 0.79%). Similarly, the demographic groups most similar to Immigrants from Eritrea are Immigrants from Grenada (21.8%, a difference of 0.010%), German (21.8%, a difference of 0.070%), Scottish (21.8%, a difference of 0.14%), Barbadian (21.8%, a difference of 0.16%), and English (21.9%, a difference of 0.34%).
| Demographics | Rating | Rank | Single Female Poverty |
| Germans | 8.3 /100 | #220 | Tragic 21.8% |
| Immigrants | Grenada | 8.0 /100 | #221 | Tragic 21.8% |
| Immigrants | Eritrea | 7.9 /100 | #222 | Tragic 21.8% |
| Scottish | 7.3 /100 | #223 | Tragic 21.8% |
| Barbadians | 7.2 /100 | #224 | Tragic 21.8% |
| English | 6.4 /100 | #225 | Tragic 21.9% |
| Immigrants | Portugal | 5.8 /100 | #226 | Tragic 21.9% |
| Immigrants | Ghana | 5.8 /100 | #227 | Tragic 21.9% |
| Salvadorans | 5.5 /100 | #228 | Tragic 21.9% |
| Tlingit-Haida | 5.4 /100 | #229 | Tragic 21.9% |
| Immigrants | Western Africa | 5.3 /100 | #230 | Tragic 22.0% |
| Welsh | 5.0 /100 | #231 | Tragic 22.0% |
| Immigrants | Thailand | 5.0 /100 | #232 | Tragic 22.0% |
| Spaniards | 4.7 /100 | #233 | Tragic 22.0% |
| Spanish | 4.7 /100 | #234 | Tragic 22.0% |
| Dutch | 4.6 /100 | #235 | Tragic 22.0% |
| Immigrants | Ecuador | 4.2 /100 | #236 | Tragic 22.0% |
| Vietnamese | 4.0 /100 | #237 | Tragic 22.0% |
| French Canadians | 2.8 /100 | #238 | Tragic 22.2% |
| Malaysians | 2.8 /100 | #239 | Tragic 22.2% |
| French | 2.3 /100 | #240 | Tragic 22.2% |