Colville vs Carpatho Rusyn Single Male Poverty
COMPARE
Colville
Carpatho Rusyn
Single Male Poverty
Single Male Poverty Comparison
Colville
Carpatho Rusyns
18.4%
SINGLE MALE POVERTY
0.0/ 100
METRIC RATING
329th/ 347
METRIC RANK
13.4%
SINGLE MALE POVERTY
2.1/ 100
METRIC RATING
242nd/ 347
METRIC RANK
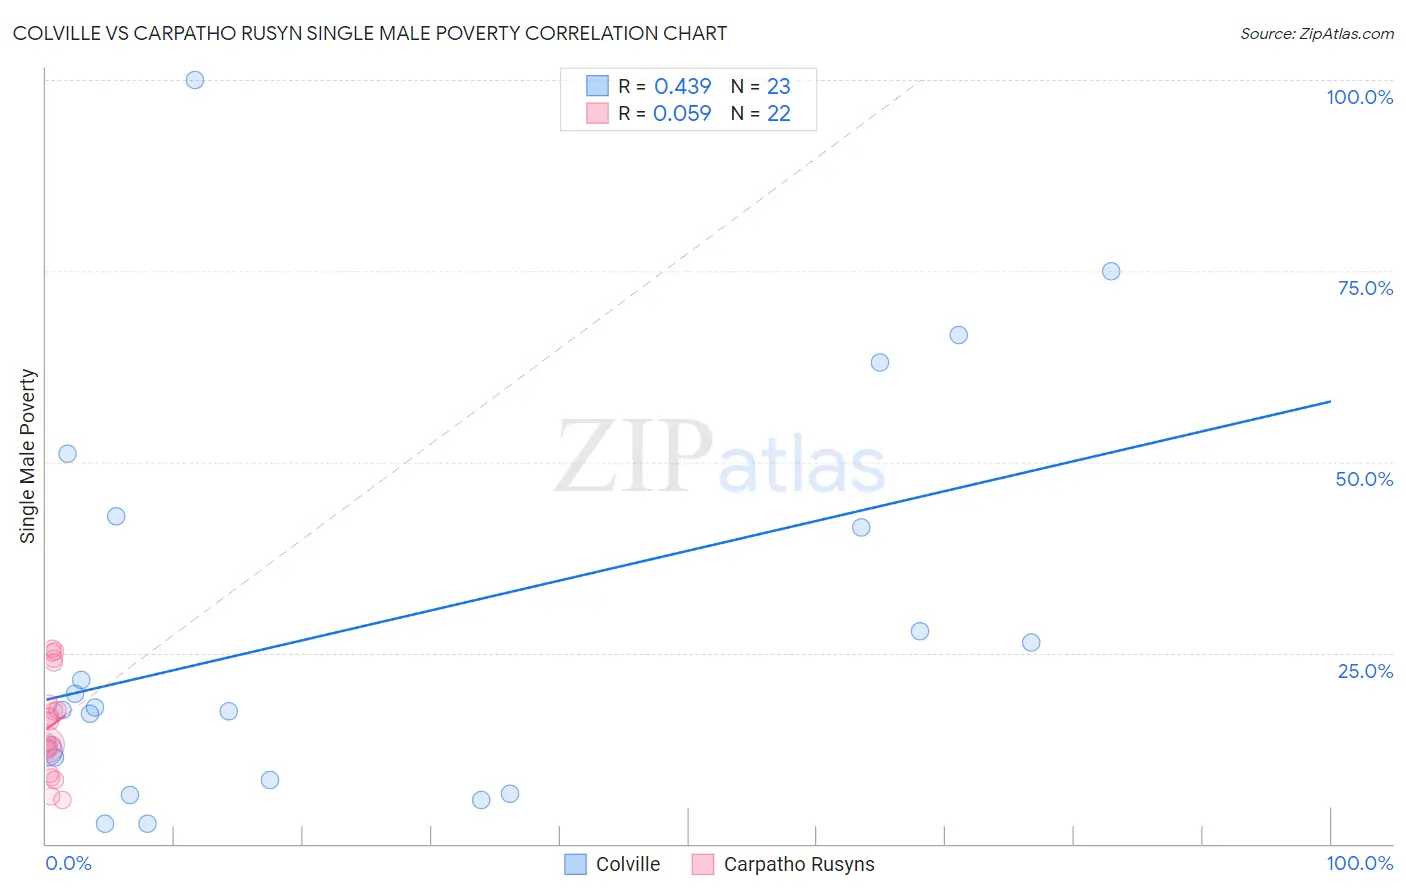
Colville vs Carpatho Rusyn Single Male Poverty Correlation Chart
The statistical analysis conducted on geographies consisting of 33,707,380 people shows a moderate positive correlation between the proportion of Colville and poverty level among single males in the United States with a correlation coefficient (R) of 0.439 and weighted average of 18.4%. Similarly, the statistical analysis conducted on geographies consisting of 56,393,502 people shows a slight positive correlation between the proportion of Carpatho Rusyns and poverty level among single males in the United States with a correlation coefficient (R) of 0.059 and weighted average of 13.4%, a difference of 37.1%.
Single Male Poverty Correlation Summary
| Measurement | Colville | Carpatho Rusyn |
| Minimum | 2.6% | 5.7% |
| Maximum | 100.0% | 25.6% |
| Range | 97.4% | 19.9% |
| Mean | 28.7% | 15.5% |
| Median | 17.8% | 14.7% |
| Interquartile 25% (IQ1) | 8.3% | 12.3% |
| Interquartile 75% (IQ3) | 42.9% | 18.3% |
| Interquartile Range (IQR) | 34.5% | 6.0% |
| Standard Deviation (Sample) | 26.3% | 6.2% |
| Standard Deviation (Population) | 25.7% | 6.1% |
Similar Demographics by Single Male Poverty
Demographics Similar to Colville by Single Male Poverty
In terms of single male poverty, the demographic groups most similar to Colville are Kiowa (18.3%, a difference of 0.73%), Cajun (19.1%, a difference of 3.5%), Menominee (17.7%, a difference of 4.0%), Paiute (19.3%, a difference of 4.6%), and Native/Alaskan (19.6%, a difference of 6.4%).
| Demographics | Rating | Rank | Single Male Poverty |
| Shoshone | 0.0 /100 | #322 | Tragic 16.7% |
| Creek | 0.0 /100 | #323 | Tragic 16.8% |
| Immigrants | Yemen | 0.0 /100 | #324 | Tragic 16.9% |
| Choctaw | 0.0 /100 | #325 | Tragic 17.0% |
| Central American Indians | 0.0 /100 | #326 | Tragic 17.2% |
| Menominee | 0.0 /100 | #327 | Tragic 17.7% |
| Kiowa | 0.0 /100 | #328 | Tragic 18.3% |
| Colville | 0.0 /100 | #329 | Tragic 18.4% |
| Cajuns | 0.0 /100 | #330 | Tragic 19.1% |
| Paiute | 0.0 /100 | #331 | Tragic 19.3% |
| Natives/Alaskans | 0.0 /100 | #332 | Tragic 19.6% |
| Inupiat | 0.0 /100 | #333 | Tragic 20.0% |
| Pima | 0.0 /100 | #334 | Tragic 20.2% |
| Yuman | 0.0 /100 | #335 | Tragic 21.3% |
| Tohono O'odham | 0.0 /100 | #336 | Tragic 21.6% |
Demographics Similar to Carpatho Rusyns by Single Male Poverty
In terms of single male poverty, the demographic groups most similar to Carpatho Rusyns are Immigrants from Germany (13.4%, a difference of 0.010%), Barbadian (13.4%, a difference of 0.050%), Belizean (13.4%, a difference of 0.12%), Immigrants from Senegal (13.5%, a difference of 0.32%), and Czechoslovakian (13.4%, a difference of 0.43%).
| Demographics | Rating | Rank | Single Male Poverty |
| Bangladeshis | 3.7 /100 | #235 | Tragic 13.3% |
| Luxembourgers | 3.6 /100 | #236 | Tragic 13.4% |
| British West Indians | 3.4 /100 | #237 | Tragic 13.4% |
| Immigrants | Ghana | 3.2 /100 | #238 | Tragic 13.4% |
| Czechoslovakians | 3.0 /100 | #239 | Tragic 13.4% |
| Belizeans | 2.3 /100 | #240 | Tragic 13.4% |
| Immigrants | Germany | 2.1 /100 | #241 | Tragic 13.4% |
| Carpatho Rusyns | 2.1 /100 | #242 | Tragic 13.4% |
| Barbadians | 2.1 /100 | #243 | Tragic 13.4% |
| Immigrants | Senegal | 1.7 /100 | #244 | Tragic 13.5% |
| Immigrants | Latin America | 1.3 /100 | #245 | Tragic 13.5% |
| Immigrants | Micronesia | 1.2 /100 | #246 | Tragic 13.5% |
| Belgians | 1.2 /100 | #247 | Tragic 13.5% |
| Czechs | 1.2 /100 | #248 | Tragic 13.5% |
| Spanish | 1.0 /100 | #249 | Tragic 13.6% |