Comanche vs Carpatho Rusyn Single Male Poverty
COMPARE
Comanche
Carpatho Rusyn
Single Male Poverty
Single Male Poverty Comparison
Comanche
Carpatho Rusyns
16.0%
SINGLE MALE POVERTY
0.0/ 100
METRIC RATING
312th/ 347
METRIC RANK
13.4%
SINGLE MALE POVERTY
2.1/ 100
METRIC RATING
242nd/ 347
METRIC RANK
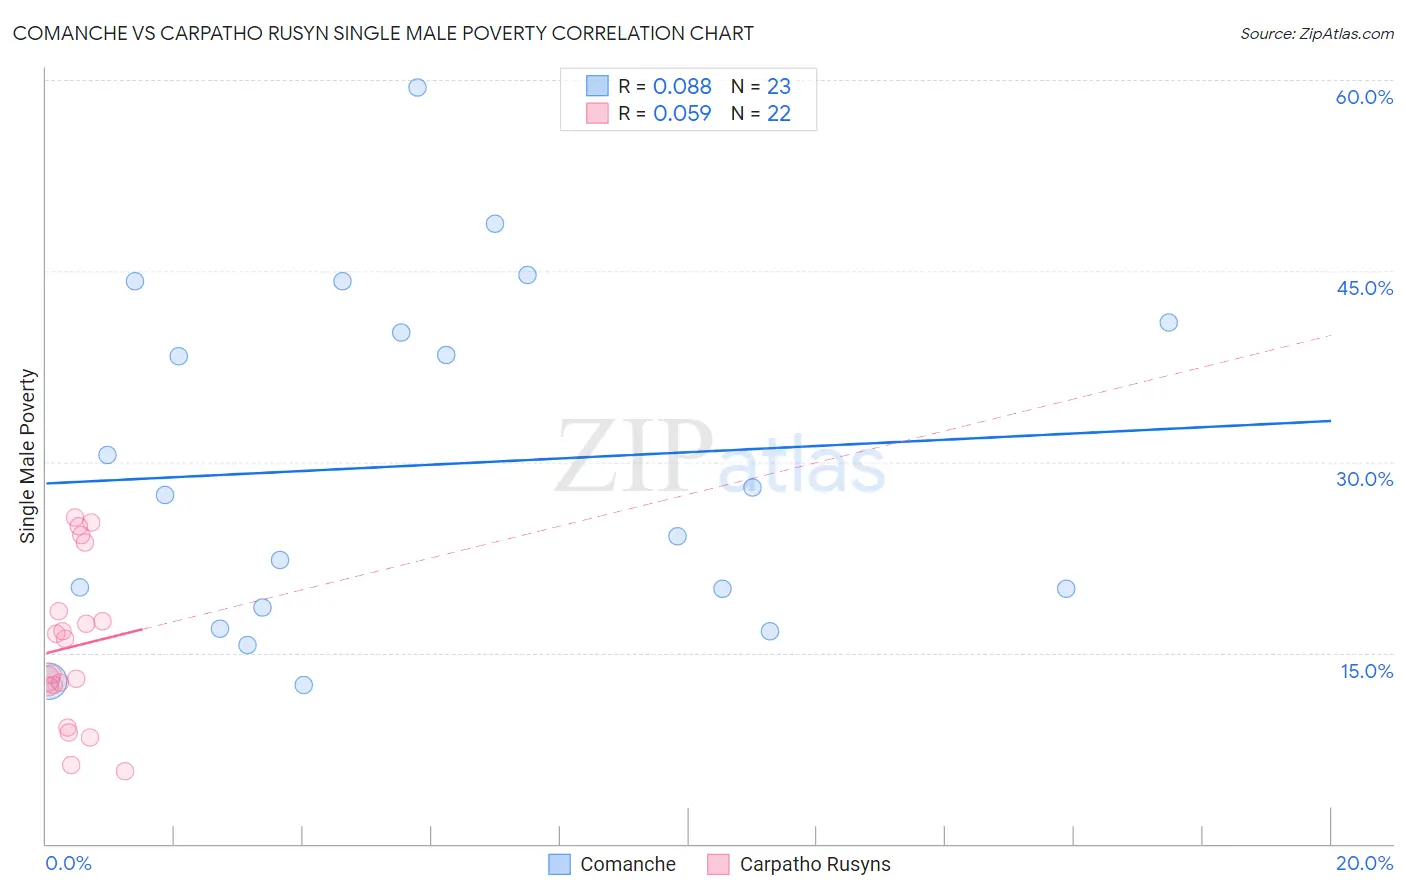
Comanche vs Carpatho Rusyn Single Male Poverty Correlation Chart
The statistical analysis conducted on geographies consisting of 105,456,343 people shows a slight positive correlation between the proportion of Comanche and poverty level among single males in the United States with a correlation coefficient (R) of 0.088 and weighted average of 16.0%. Similarly, the statistical analysis conducted on geographies consisting of 56,393,502 people shows a slight positive correlation between the proportion of Carpatho Rusyns and poverty level among single males in the United States with a correlation coefficient (R) of 0.059 and weighted average of 13.4%, a difference of 19.2%.
Single Male Poverty Correlation Summary
| Measurement | Comanche | Carpatho Rusyn |
| Minimum | 12.5% | 5.7% |
| Maximum | 59.4% | 25.6% |
| Range | 46.9% | 19.9% |
| Mean | 29.8% | 15.5% |
| Median | 27.4% | 14.7% |
| Interquartile 25% (IQ1) | 18.6% | 12.3% |
| Interquartile 75% (IQ3) | 40.9% | 18.3% |
| Interquartile Range (IQR) | 22.4% | 6.0% |
| Standard Deviation (Sample) | 13.3% | 6.2% |
| Standard Deviation (Population) | 13.0% | 6.1% |
Similar Demographics by Single Male Poverty
Demographics Similar to Comanche by Single Male Poverty
In terms of single male poverty, the demographic groups most similar to Comanche are Seminole (16.0%, a difference of 0.0%), Cherokee (16.1%, a difference of 0.23%), Alaskan Athabascan (16.1%, a difference of 0.52%), Yakama (15.9%, a difference of 0.54%), and Cheyenne (16.1%, a difference of 0.56%).
| Demographics | Rating | Rank | Single Male Poverty |
| Blackfeet | 0.0 /100 | #305 | Tragic 15.5% |
| Pennsylvania Germans | 0.0 /100 | #306 | Tragic 15.6% |
| Ute | 0.0 /100 | #307 | Tragic 15.7% |
| Potawatomi | 0.0 /100 | #308 | Tragic 15.8% |
| Americans | 0.0 /100 | #309 | Tragic 15.8% |
| Yakama | 0.0 /100 | #310 | Tragic 15.9% |
| Seminole | 0.0 /100 | #311 | Tragic 16.0% |
| Comanche | 0.0 /100 | #312 | Tragic 16.0% |
| Cherokee | 0.0 /100 | #313 | Tragic 16.1% |
| Alaskan Athabascans | 0.0 /100 | #314 | Tragic 16.1% |
| Cheyenne | 0.0 /100 | #315 | Tragic 16.1% |
| Dutch West Indians | 0.0 /100 | #316 | Tragic 16.1% |
| Blacks/African Americans | 0.0 /100 | #317 | Tragic 16.2% |
| Chickasaw | 0.0 /100 | #318 | Tragic 16.3% |
| Chippewa | 0.0 /100 | #319 | Tragic 16.4% |
Demographics Similar to Carpatho Rusyns by Single Male Poverty
In terms of single male poverty, the demographic groups most similar to Carpatho Rusyns are Immigrants from Germany (13.4%, a difference of 0.010%), Barbadian (13.4%, a difference of 0.050%), Belizean (13.4%, a difference of 0.12%), Immigrants from Senegal (13.5%, a difference of 0.32%), and Czechoslovakian (13.4%, a difference of 0.43%).
| Demographics | Rating | Rank | Single Male Poverty |
| Bangladeshis | 3.7 /100 | #235 | Tragic 13.3% |
| Luxembourgers | 3.6 /100 | #236 | Tragic 13.4% |
| British West Indians | 3.4 /100 | #237 | Tragic 13.4% |
| Immigrants | Ghana | 3.2 /100 | #238 | Tragic 13.4% |
| Czechoslovakians | 3.0 /100 | #239 | Tragic 13.4% |
| Belizeans | 2.3 /100 | #240 | Tragic 13.4% |
| Immigrants | Germany | 2.1 /100 | #241 | Tragic 13.4% |
| Carpatho Rusyns | 2.1 /100 | #242 | Tragic 13.4% |
| Barbadians | 2.1 /100 | #243 | Tragic 13.4% |
| Immigrants | Senegal | 1.7 /100 | #244 | Tragic 13.5% |
| Immigrants | Latin America | 1.3 /100 | #245 | Tragic 13.5% |
| Immigrants | Micronesia | 1.2 /100 | #246 | Tragic 13.5% |
| Belgians | 1.2 /100 | #247 | Tragic 13.5% |
| Czechs | 1.2 /100 | #248 | Tragic 13.5% |
| Spanish | 1.0 /100 | #249 | Tragic 13.6% |