Immigrants from Albania vs Carpatho Rusyn Single Male Poverty
COMPARE
Immigrants from Albania
Carpatho Rusyn
Single Male Poverty
Single Male Poverty Comparison
Immigrants from Albania
Carpatho Rusyns
12.4%
SINGLE MALE POVERTY
90.3/ 100
METRIC RATING
119th/ 347
METRIC RANK
13.4%
SINGLE MALE POVERTY
2.1/ 100
METRIC RATING
242nd/ 347
METRIC RANK
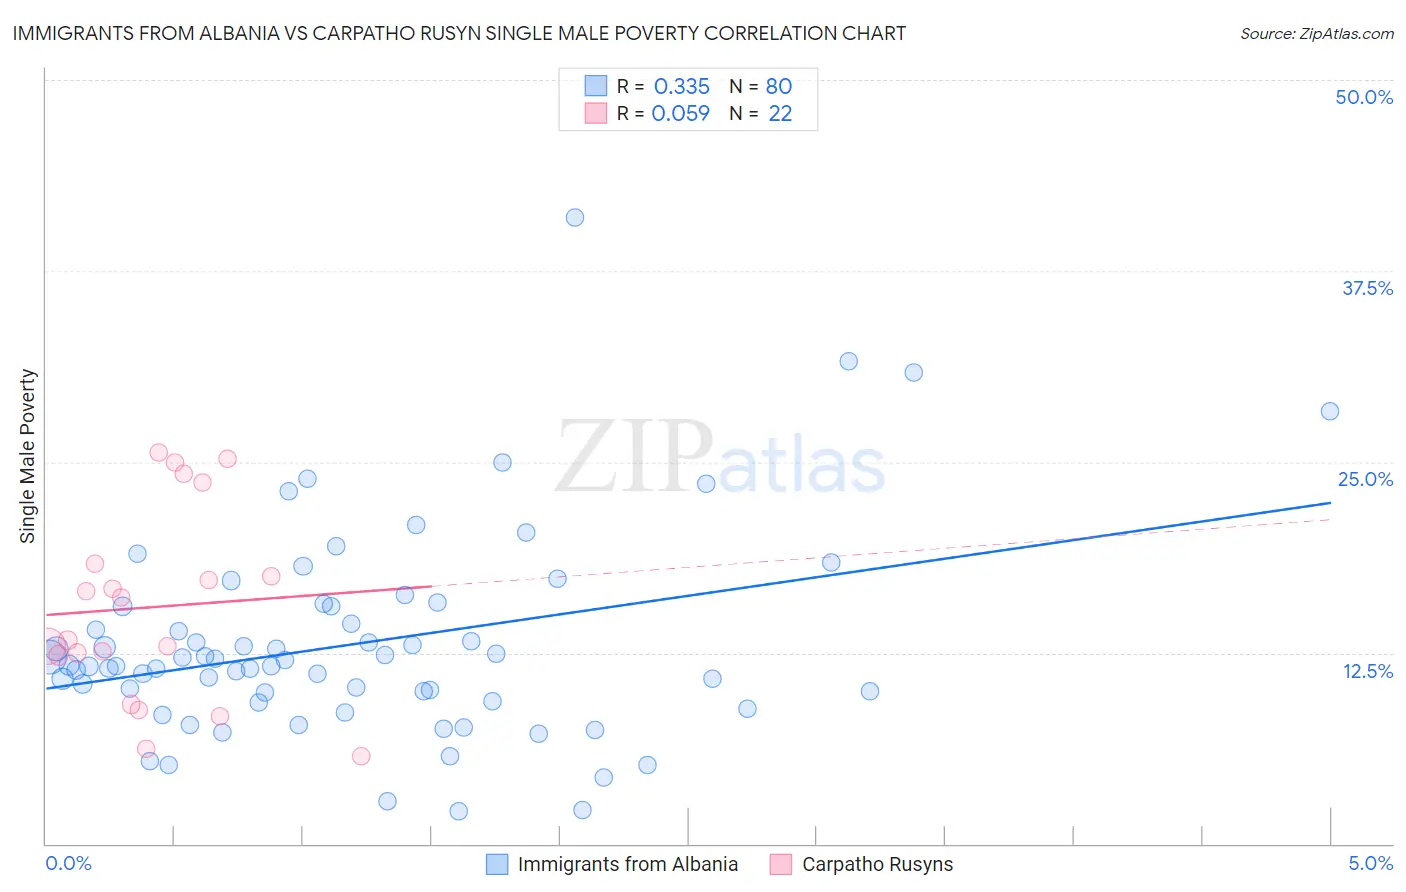
Immigrants from Albania vs Carpatho Rusyn Single Male Poverty Correlation Chart
The statistical analysis conducted on geographies consisting of 110,814,842 people shows a mild positive correlation between the proportion of Immigrants from Albania and poverty level among single males in the United States with a correlation coefficient (R) of 0.335 and weighted average of 12.4%. Similarly, the statistical analysis conducted on geographies consisting of 56,393,502 people shows a slight positive correlation between the proportion of Carpatho Rusyns and poverty level among single males in the United States with a correlation coefficient (R) of 0.059 and weighted average of 13.4%, a difference of 8.2%.
Single Male Poverty Correlation Summary
| Measurement | Immigrants from Albania | Carpatho Rusyn |
| Minimum | 2.1% | 5.7% |
| Maximum | 41.0% | 25.6% |
| Range | 38.9% | 19.9% |
| Mean | 13.1% | 15.5% |
| Median | 11.7% | 14.7% |
| Interquartile 25% (IQ1) | 9.6% | 12.3% |
| Interquartile 75% (IQ3) | 15.5% | 18.3% |
| Interquartile Range (IQR) | 5.9% | 6.0% |
| Standard Deviation (Sample) | 6.7% | 6.2% |
| Standard Deviation (Population) | 6.6% | 6.1% |
Similar Demographics by Single Male Poverty
Demographics Similar to Immigrants from Albania by Single Male Poverty
In terms of single male poverty, the demographic groups most similar to Immigrants from Albania are Albanian (12.4%, a difference of 0.030%), Immigrants from Oceania (12.4%, a difference of 0.13%), Immigrants from Syria (12.4%, a difference of 0.14%), Venezuelan (12.4%, a difference of 0.14%), and Immigrants from Southern Europe (12.4%, a difference of 0.20%).
| Demographics | Rating | Rank | Single Male Poverty |
| Kenyans | 93.3 /100 | #112 | Exceptional 12.4% |
| Pakistanis | 92.4 /100 | #113 | Exceptional 12.4% |
| Nicaraguans | 92.1 /100 | #114 | Exceptional 12.4% |
| Immigrants | Southern Europe | 91.5 /100 | #115 | Exceptional 12.4% |
| Immigrants | Syria | 91.2 /100 | #116 | Exceptional 12.4% |
| Immigrants | Oceania | 91.1 /100 | #117 | Exceptional 12.4% |
| Albanians | 90.6 /100 | #118 | Exceptional 12.4% |
| Immigrants | Albania | 90.3 /100 | #119 | Exceptional 12.4% |
| Venezuelans | 89.4 /100 | #120 | Excellent 12.4% |
| Icelanders | 88.2 /100 | #121 | Excellent 12.5% |
| Serbians | 87.9 /100 | #122 | Excellent 12.5% |
| Immigrants | Kenya | 87.6 /100 | #123 | Excellent 12.5% |
| Russians | 87.3 /100 | #124 | Excellent 12.5% |
| Immigrants | Jordan | 87.1 /100 | #125 | Excellent 12.5% |
| Romanians | 86.4 /100 | #126 | Excellent 12.5% |
Demographics Similar to Carpatho Rusyns by Single Male Poverty
In terms of single male poverty, the demographic groups most similar to Carpatho Rusyns are Immigrants from Germany (13.4%, a difference of 0.010%), Barbadian (13.4%, a difference of 0.050%), Belizean (13.4%, a difference of 0.12%), Immigrants from Senegal (13.5%, a difference of 0.32%), and Czechoslovakian (13.4%, a difference of 0.43%).
| Demographics | Rating | Rank | Single Male Poverty |
| Bangladeshis | 3.7 /100 | #235 | Tragic 13.3% |
| Luxembourgers | 3.6 /100 | #236 | Tragic 13.4% |
| British West Indians | 3.4 /100 | #237 | Tragic 13.4% |
| Immigrants | Ghana | 3.2 /100 | #238 | Tragic 13.4% |
| Czechoslovakians | 3.0 /100 | #239 | Tragic 13.4% |
| Belizeans | 2.3 /100 | #240 | Tragic 13.4% |
| Immigrants | Germany | 2.1 /100 | #241 | Tragic 13.4% |
| Carpatho Rusyns | 2.1 /100 | #242 | Tragic 13.4% |
| Barbadians | 2.1 /100 | #243 | Tragic 13.4% |
| Immigrants | Senegal | 1.7 /100 | #244 | Tragic 13.5% |
| Immigrants | Latin America | 1.3 /100 | #245 | Tragic 13.5% |
| Immigrants | Micronesia | 1.2 /100 | #246 | Tragic 13.5% |
| Belgians | 1.2 /100 | #247 | Tragic 13.5% |
| Czechs | 1.2 /100 | #248 | Tragic 13.5% |
| Spanish | 1.0 /100 | #249 | Tragic 13.6% |