Immigrants from Korea vs Carpatho Rusyn Single Male Poverty
COMPARE
Immigrants from Korea
Carpatho Rusyn
Single Male Poverty
Single Male Poverty Comparison
Immigrants from Korea
Carpatho Rusyns
11.5%
SINGLE MALE POVERTY
100.0/ 100
METRIC RATING
40th/ 347
METRIC RANK
13.4%
SINGLE MALE POVERTY
2.1/ 100
METRIC RATING
242nd/ 347
METRIC RANK
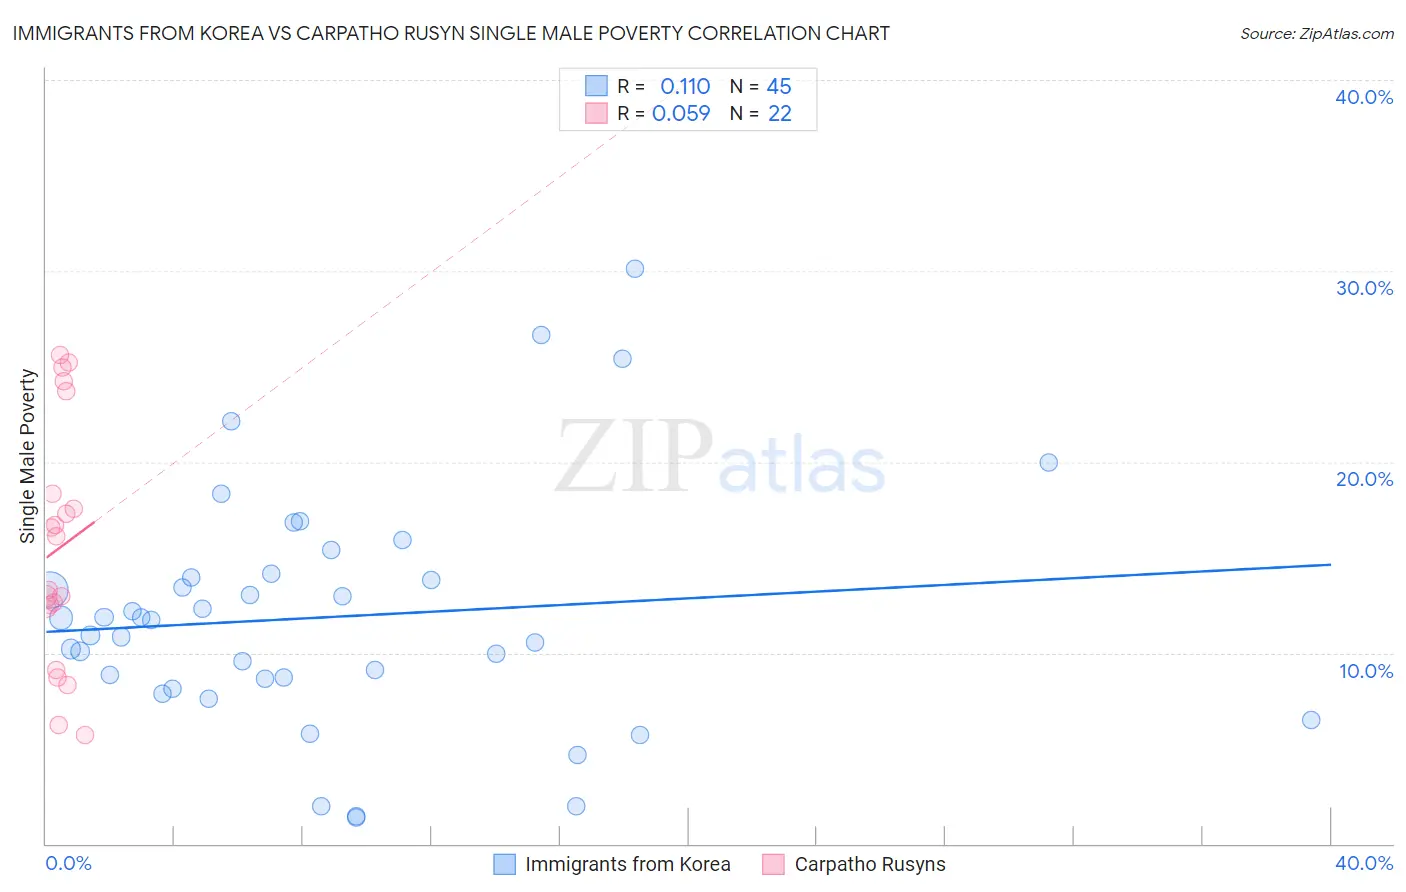
Immigrants from Korea vs Carpatho Rusyn Single Male Poverty Correlation Chart
The statistical analysis conducted on geographies consisting of 364,058,010 people shows a poor positive correlation between the proportion of Immigrants from Korea and poverty level among single males in the United States with a correlation coefficient (R) of 0.110 and weighted average of 11.5%. Similarly, the statistical analysis conducted on geographies consisting of 56,393,502 people shows a slight positive correlation between the proportion of Carpatho Rusyns and poverty level among single males in the United States with a correlation coefficient (R) of 0.059 and weighted average of 13.4%, a difference of 16.9%.
Single Male Poverty Correlation Summary
| Measurement | Immigrants from Korea | Carpatho Rusyn |
| Minimum | 1.4% | 5.7% |
| Maximum | 30.1% | 25.6% |
| Range | 28.7% | 19.9% |
| Mean | 11.9% | 15.5% |
| Median | 11.7% | 14.7% |
| Interquartile 25% (IQ1) | 8.4% | 12.3% |
| Interquartile 75% (IQ3) | 14.1% | 18.3% |
| Interquartile Range (IQR) | 5.7% | 6.0% |
| Standard Deviation (Sample) | 6.3% | 6.2% |
| Standard Deviation (Population) | 6.2% | 6.1% |
Similar Demographics by Single Male Poverty
Demographics Similar to Immigrants from Korea by Single Male Poverty
In terms of single male poverty, the demographic groups most similar to Immigrants from Korea are Immigrants from Iraq (11.5%, a difference of 0.15%), Egyptian (11.5%, a difference of 0.20%), Soviet Union (11.5%, a difference of 0.33%), Immigrants from Peru (11.5%, a difference of 0.36%), and Immigrants from Cameroon (11.5%, a difference of 0.37%).
| Demographics | Rating | Rank | Single Male Poverty |
| Immigrants | Vietnam | 100.0 /100 | #33 | Exceptional 11.4% |
| Immigrants | Ethiopia | 100.0 /100 | #34 | Exceptional 11.4% |
| Immigrants | South Eastern Asia | 100.0 /100 | #35 | Exceptional 11.4% |
| Immigrants | Serbia | 100.0 /100 | #36 | Exceptional 11.4% |
| Immigrants | Singapore | 100.0 /100 | #37 | Exceptional 11.4% |
| Sri Lankans | 100.0 /100 | #38 | Exceptional 11.5% |
| Soviet Union | 100.0 /100 | #39 | Exceptional 11.5% |
| Immigrants | Korea | 100.0 /100 | #40 | Exceptional 11.5% |
| Immigrants | Iraq | 99.9 /100 | #41 | Exceptional 11.5% |
| Egyptians | 99.9 /100 | #42 | Exceptional 11.5% |
| Immigrants | Peru | 99.9 /100 | #43 | Exceptional 11.5% |
| Immigrants | Cameroon | 99.9 /100 | #44 | Exceptional 11.5% |
| Immigrants | Poland | 99.9 /100 | #45 | Exceptional 11.5% |
| Immigrants | Bulgaria | 99.9 /100 | #46 | Exceptional 11.6% |
| Nepalese | 99.9 /100 | #47 | Exceptional 11.6% |
Demographics Similar to Carpatho Rusyns by Single Male Poverty
In terms of single male poverty, the demographic groups most similar to Carpatho Rusyns are Immigrants from Germany (13.4%, a difference of 0.010%), Barbadian (13.4%, a difference of 0.050%), Belizean (13.4%, a difference of 0.12%), Immigrants from Senegal (13.5%, a difference of 0.32%), and Czechoslovakian (13.4%, a difference of 0.43%).
| Demographics | Rating | Rank | Single Male Poverty |
| Bangladeshis | 3.7 /100 | #235 | Tragic 13.3% |
| Luxembourgers | 3.6 /100 | #236 | Tragic 13.4% |
| British West Indians | 3.4 /100 | #237 | Tragic 13.4% |
| Immigrants | Ghana | 3.2 /100 | #238 | Tragic 13.4% |
| Czechoslovakians | 3.0 /100 | #239 | Tragic 13.4% |
| Belizeans | 2.3 /100 | #240 | Tragic 13.4% |
| Immigrants | Germany | 2.1 /100 | #241 | Tragic 13.4% |
| Carpatho Rusyns | 2.1 /100 | #242 | Tragic 13.4% |
| Barbadians | 2.1 /100 | #243 | Tragic 13.4% |
| Immigrants | Senegal | 1.7 /100 | #244 | Tragic 13.5% |
| Immigrants | Latin America | 1.3 /100 | #245 | Tragic 13.5% |
| Immigrants | Micronesia | 1.2 /100 | #246 | Tragic 13.5% |
| Belgians | 1.2 /100 | #247 | Tragic 13.5% |
| Czechs | 1.2 /100 | #248 | Tragic 13.5% |
| Spanish | 1.0 /100 | #249 | Tragic 13.6% |