Colville vs Somali Single Male Poverty
COMPARE
Colville
Somali
Single Male Poverty
Single Male Poverty Comparison
Colville
Somalis
18.4%
SINGLE MALE POVERTY
0.0/ 100
METRIC RATING
329th/ 347
METRIC RANK
13.2%
SINGLE MALE POVERTY
9.1/ 100
METRIC RATING
224th/ 347
METRIC RANK
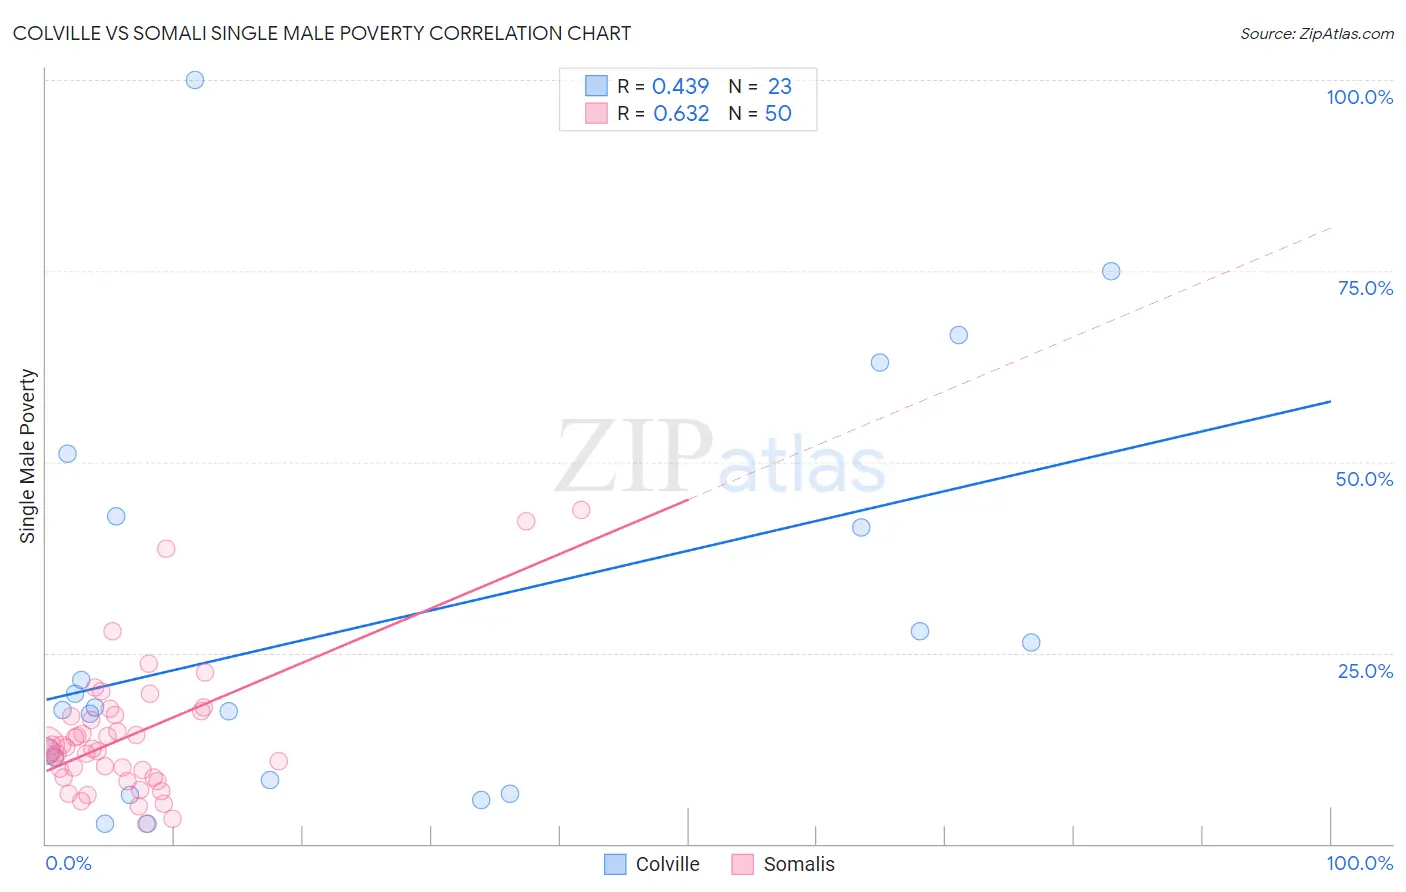
Colville vs Somali Single Male Poverty Correlation Chart
The statistical analysis conducted on geographies consisting of 33,707,380 people shows a moderate positive correlation between the proportion of Colville and poverty level among single males in the United States with a correlation coefficient (R) of 0.439 and weighted average of 18.4%. Similarly, the statistical analysis conducted on geographies consisting of 95,264,577 people shows a significant positive correlation between the proportion of Somalis and poverty level among single males in the United States with a correlation coefficient (R) of 0.632 and weighted average of 13.2%, a difference of 39.8%.
Single Male Poverty Correlation Summary
| Measurement | Colville | Somali |
| Minimum | 2.6% | 2.6% |
| Maximum | 100.0% | 43.7% |
| Range | 97.4% | 41.1% |
| Mean | 28.7% | 14.2% |
| Median | 17.8% | 12.6% |
| Interquartile 25% (IQ1) | 8.3% | 8.7% |
| Interquartile 75% (IQ3) | 42.9% | 16.8% |
| Interquartile Range (IQR) | 34.5% | 8.1% |
| Standard Deviation (Sample) | 26.3% | 8.7% |
| Standard Deviation (Population) | 25.7% | 8.6% |
Similar Demographics by Single Male Poverty
Demographics Similar to Colville by Single Male Poverty
In terms of single male poverty, the demographic groups most similar to Colville are Kiowa (18.3%, a difference of 0.73%), Cajun (19.1%, a difference of 3.5%), Menominee (17.7%, a difference of 4.0%), Paiute (19.3%, a difference of 4.6%), and Native/Alaskan (19.6%, a difference of 6.4%).
| Demographics | Rating | Rank | Single Male Poverty |
| Shoshone | 0.0 /100 | #322 | Tragic 16.7% |
| Creek | 0.0 /100 | #323 | Tragic 16.8% |
| Immigrants | Yemen | 0.0 /100 | #324 | Tragic 16.9% |
| Choctaw | 0.0 /100 | #325 | Tragic 17.0% |
| Central American Indians | 0.0 /100 | #326 | Tragic 17.2% |
| Menominee | 0.0 /100 | #327 | Tragic 17.7% |
| Kiowa | 0.0 /100 | #328 | Tragic 18.3% |
| Colville | 0.0 /100 | #329 | Tragic 18.4% |
| Cajuns | 0.0 /100 | #330 | Tragic 19.1% |
| Paiute | 0.0 /100 | #331 | Tragic 19.3% |
| Natives/Alaskans | 0.0 /100 | #332 | Tragic 19.6% |
| Inupiat | 0.0 /100 | #333 | Tragic 20.0% |
| Pima | 0.0 /100 | #334 | Tragic 20.2% |
| Yuman | 0.0 /100 | #335 | Tragic 21.3% |
| Tohono O'odham | 0.0 /100 | #336 | Tragic 21.6% |
Demographics Similar to Somalis by Single Male Poverty
In terms of single male poverty, the demographic groups most similar to Somalis are Immigrants from the Azores (13.2%, a difference of 0.030%), Immigrants from Denmark (13.2%, a difference of 0.050%), Immigrants from Western Europe (13.2%, a difference of 0.15%), Jamaican (13.2%, a difference of 0.22%), and New Zealander (13.2%, a difference of 0.24%).
| Demographics | Rating | Rank | Single Male Poverty |
| Bermudans | 13.0 /100 | #217 | Poor 13.1% |
| Scandinavians | 12.9 /100 | #218 | Poor 13.1% |
| Immigrants | Burma/Myanmar | 12.6 /100 | #219 | Poor 13.1% |
| Central Americans | 10.9 /100 | #220 | Poor 13.2% |
| New Zealanders | 10.7 /100 | #221 | Poor 13.2% |
| Immigrants | Western Europe | 10.0 /100 | #222 | Poor 13.2% |
| Immigrants | Azores | 9.3 /100 | #223 | Tragic 13.2% |
| Somalis | 9.1 /100 | #224 | Tragic 13.2% |
| Immigrants | Denmark | 8.7 /100 | #225 | Tragic 13.2% |
| Jamaicans | 7.7 /100 | #226 | Tragic 13.2% |
| Haitians | 7.0 /100 | #227 | Tragic 13.2% |
| Lebanese | 6.6 /100 | #228 | Tragic 13.2% |
| Europeans | 6.2 /100 | #229 | Tragic 13.3% |
| Ghanaians | 6.1 /100 | #230 | Tragic 13.3% |
| Slavs | 5.3 /100 | #231 | Tragic 13.3% |