Colville vs Cape Verdean Single Male Poverty
COMPARE
Colville
Cape Verdean
Single Male Poverty
Single Male Poverty Comparison
Colville
Cape Verdeans
18.4%
SINGLE MALE POVERTY
0.0/ 100
METRIC RATING
329th/ 347
METRIC RANK
13.8%
SINGLE MALE POVERTY
0.2/ 100
METRIC RATING
263rd/ 347
METRIC RANK
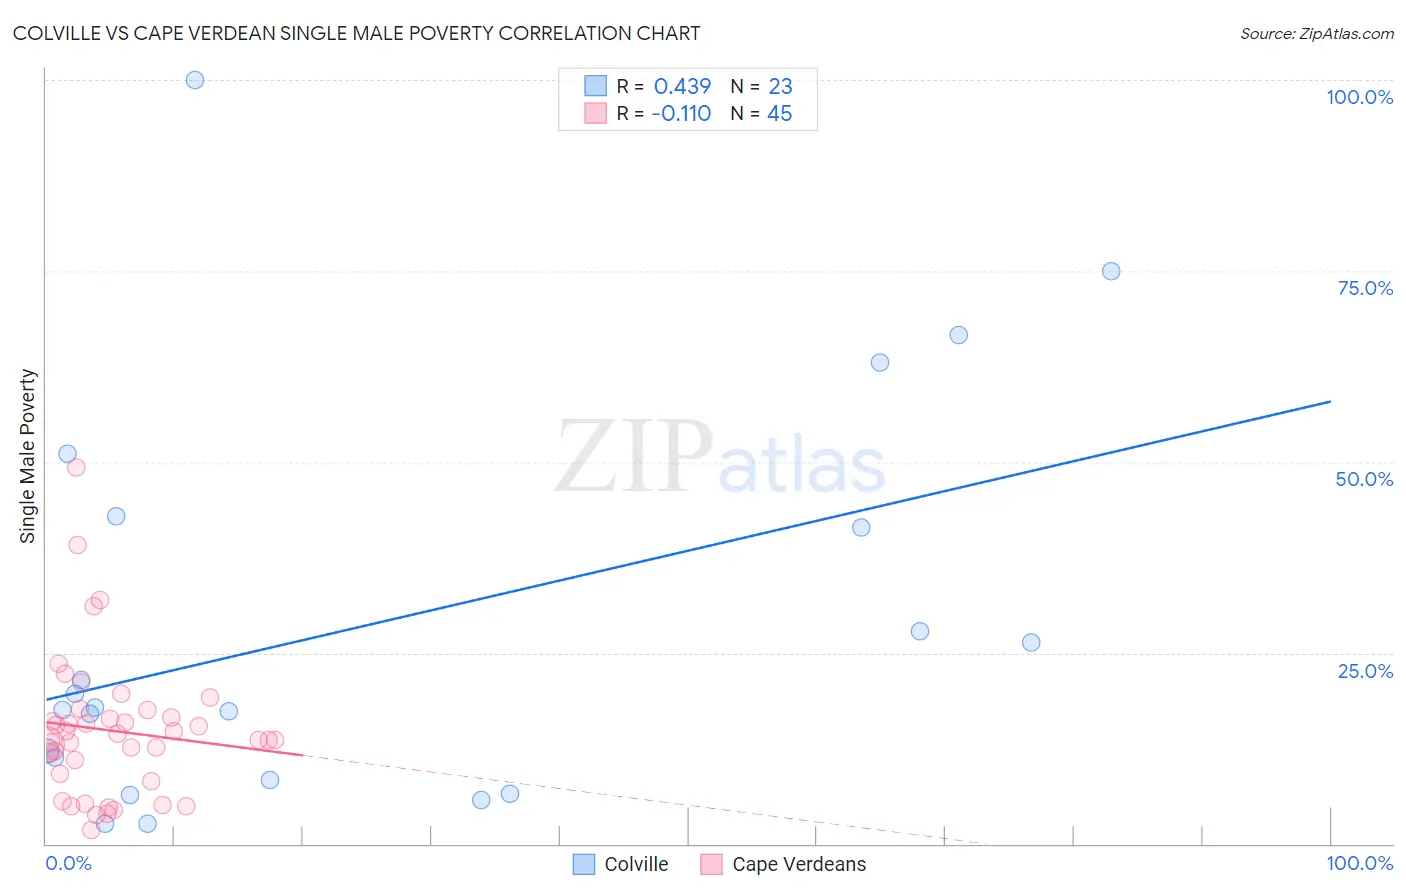
Colville vs Cape Verdean Single Male Poverty Correlation Chart
The statistical analysis conducted on geographies consisting of 33,707,380 people shows a moderate positive correlation between the proportion of Colville and poverty level among single males in the United States with a correlation coefficient (R) of 0.439 and weighted average of 18.4%. Similarly, the statistical analysis conducted on geographies consisting of 101,894,910 people shows a poor negative correlation between the proportion of Cape Verdeans and poverty level among single males in the United States with a correlation coefficient (R) of -0.110 and weighted average of 13.8%, a difference of 33.4%.
Single Male Poverty Correlation Summary
| Measurement | Colville | Cape Verdean |
| Minimum | 2.6% | 1.7% |
| Maximum | 100.0% | 49.2% |
| Range | 97.4% | 47.5% |
| Mean | 28.7% | 14.8% |
| Median | 17.8% | 13.6% |
| Interquartile 25% (IQ1) | 8.3% | 8.7% |
| Interquartile 75% (IQ3) | 42.9% | 17.1% |
| Interquartile Range (IQR) | 34.5% | 8.4% |
| Standard Deviation (Sample) | 26.3% | 9.3% |
| Standard Deviation (Population) | 25.7% | 9.2% |
Similar Demographics by Single Male Poverty
Demographics Similar to Colville by Single Male Poverty
In terms of single male poverty, the demographic groups most similar to Colville are Kiowa (18.3%, a difference of 0.73%), Cajun (19.1%, a difference of 3.5%), Menominee (17.7%, a difference of 4.0%), Paiute (19.3%, a difference of 4.6%), and Native/Alaskan (19.6%, a difference of 6.4%).
| Demographics | Rating | Rank | Single Male Poverty |
| Shoshone | 0.0 /100 | #322 | Tragic 16.7% |
| Creek | 0.0 /100 | #323 | Tragic 16.8% |
| Immigrants | Yemen | 0.0 /100 | #324 | Tragic 16.9% |
| Choctaw | 0.0 /100 | #325 | Tragic 17.0% |
| Central American Indians | 0.0 /100 | #326 | Tragic 17.2% |
| Menominee | 0.0 /100 | #327 | Tragic 17.7% |
| Kiowa | 0.0 /100 | #328 | Tragic 18.3% |
| Colville | 0.0 /100 | #329 | Tragic 18.4% |
| Cajuns | 0.0 /100 | #330 | Tragic 19.1% |
| Paiute | 0.0 /100 | #331 | Tragic 19.3% |
| Natives/Alaskans | 0.0 /100 | #332 | Tragic 19.6% |
| Inupiat | 0.0 /100 | #333 | Tragic 20.0% |
| Pima | 0.0 /100 | #334 | Tragic 20.2% |
| Yuman | 0.0 /100 | #335 | Tragic 21.3% |
| Tohono O'odham | 0.0 /100 | #336 | Tragic 21.6% |
Demographics Similar to Cape Verdeans by Single Male Poverty
In terms of single male poverty, the demographic groups most similar to Cape Verdeans are Fijian (13.8%, a difference of 0.12%), West Indian (13.8%, a difference of 0.19%), Hungarian (13.8%, a difference of 0.29%), Swiss (13.8%, a difference of 0.34%), and Immigrants from Congo (13.9%, a difference of 0.35%).
| Demographics | Rating | Rank | Single Male Poverty |
| Immigrants | Belize | 0.4 /100 | #256 | Tragic 13.7% |
| Immigrants | Central America | 0.3 /100 | #257 | Tragic 13.8% |
| Immigrants | Guatemala | 0.3 /100 | #258 | Tragic 13.8% |
| Guatemalans | 0.3 /100 | #259 | Tragic 13.8% |
| Swiss | 0.3 /100 | #260 | Tragic 13.8% |
| Hungarians | 0.3 /100 | #261 | Tragic 13.8% |
| Fijians | 0.3 /100 | #262 | Tragic 13.8% |
| Cape Verdeans | 0.2 /100 | #263 | Tragic 13.8% |
| West Indians | 0.2 /100 | #264 | Tragic 13.8% |
| Immigrants | Congo | 0.2 /100 | #265 | Tragic 13.9% |
| Immigrants | Cabo Verde | 0.1 /100 | #266 | Tragic 13.9% |
| Germans | 0.1 /100 | #267 | Tragic 13.9% |
| Immigrants | Mexico | 0.1 /100 | #268 | Tragic 13.9% |
| Scottish | 0.1 /100 | #269 | Tragic 14.0% |
| Immigrants | Saudi Arabia | 0.1 /100 | #270 | Tragic 14.0% |