European vs Carpatho Rusyn Single Male Poverty
COMPARE
European
Carpatho Rusyn
Single Male Poverty
Single Male Poverty Comparison
Europeans
Carpatho Rusyns
13.3%
SINGLE MALE POVERTY
6.2/ 100
METRIC RATING
229th/ 347
METRIC RANK
13.4%
SINGLE MALE POVERTY
2.1/ 100
METRIC RATING
242nd/ 347
METRIC RANK
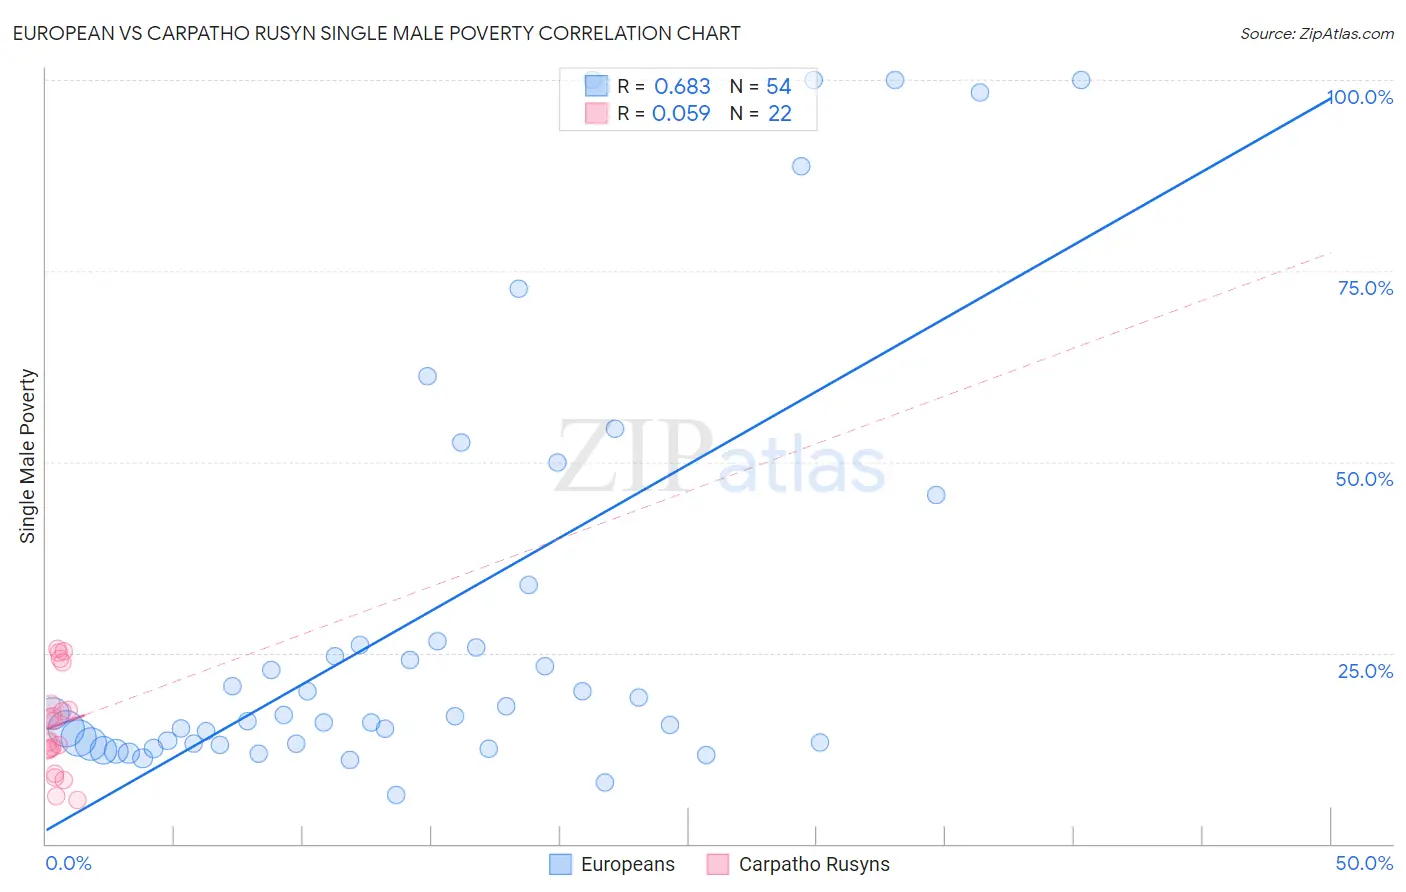
European vs Carpatho Rusyn Single Male Poverty Correlation Chart
The statistical analysis conducted on geographies consisting of 466,343,596 people shows a significant positive correlation between the proportion of Europeans and poverty level among single males in the United States with a correlation coefficient (R) of 0.683 and weighted average of 13.3%. Similarly, the statistical analysis conducted on geographies consisting of 56,393,502 people shows a slight positive correlation between the proportion of Carpatho Rusyns and poverty level among single males in the United States with a correlation coefficient (R) of 0.059 and weighted average of 13.4%, a difference of 1.4%.
Single Male Poverty Correlation Summary
| Measurement | European | Carpatho Rusyn |
| Minimum | 6.4% | 5.7% |
| Maximum | 100.0% | 25.6% |
| Range | 93.6% | 19.9% |
| Mean | 29.9% | 15.5% |
| Median | 16.8% | 14.7% |
| Interquartile 25% (IQ1) | 13.1% | 12.3% |
| Interquartile 75% (IQ3) | 26.5% | 18.3% |
| Interquartile Range (IQR) | 13.3% | 6.0% |
| Standard Deviation (Sample) | 27.9% | 6.2% |
| Standard Deviation (Population) | 27.6% | 6.1% |
Demographics Similar to Europeans and Carpatho Rusyns by Single Male Poverty
In terms of single male poverty, the demographic groups most similar to Europeans are Ghanaian (13.3%, a difference of 0.030%), Lebanese (13.2%, a difference of 0.090%), Haitian (13.2%, a difference of 0.17%), Slavic (13.3%, a difference of 0.20%), and Immigrants from Caribbean (13.3%, a difference of 0.30%). Similarly, the demographic groups most similar to Carpatho Rusyns are Immigrants from Germany (13.4%, a difference of 0.010%), Barbadian (13.4%, a difference of 0.050%), Belizean (13.4%, a difference of 0.12%), Immigrants from Senegal (13.5%, a difference of 0.32%), and Czechoslovakian (13.4%, a difference of 0.43%).
| Demographics | Rating | Rank | Single Male Poverty |
| Immigrants | Denmark | 8.7 /100 | #225 | Tragic 13.2% |
| Jamaicans | 7.7 /100 | #226 | Tragic 13.2% |
| Haitians | 7.0 /100 | #227 | Tragic 13.2% |
| Lebanese | 6.6 /100 | #228 | Tragic 13.2% |
| Europeans | 6.2 /100 | #229 | Tragic 13.3% |
| Ghanaians | 6.1 /100 | #230 | Tragic 13.3% |
| Slavs | 5.3 /100 | #231 | Tragic 13.3% |
| Immigrants | Caribbean | 5.0 /100 | #232 | Tragic 13.3% |
| British | 4.0 /100 | #233 | Tragic 13.3% |
| Canadians | 4.0 /100 | #234 | Tragic 13.3% |
| Bangladeshis | 3.7 /100 | #235 | Tragic 13.3% |
| Luxembourgers | 3.6 /100 | #236 | Tragic 13.4% |
| British West Indians | 3.4 /100 | #237 | Tragic 13.4% |
| Immigrants | Ghana | 3.2 /100 | #238 | Tragic 13.4% |
| Czechoslovakians | 3.0 /100 | #239 | Tragic 13.4% |
| Belizeans | 2.3 /100 | #240 | Tragic 13.4% |
| Immigrants | Germany | 2.1 /100 | #241 | Tragic 13.4% |
| Carpatho Rusyns | 2.1 /100 | #242 | Tragic 13.4% |
| Barbadians | 2.1 /100 | #243 | Tragic 13.4% |
| Immigrants | Senegal | 1.7 /100 | #244 | Tragic 13.5% |
| Immigrants | Latin America | 1.3 /100 | #245 | Tragic 13.5% |