Sudanese vs Carpatho Rusyn Single Male Poverty
COMPARE
Sudanese
Carpatho Rusyn
Single Male Poverty
Single Male Poverty Comparison
Sudanese
Carpatho Rusyns
13.1%
SINGLE MALE POVERTY
17.7/ 100
METRIC RATING
207th/ 347
METRIC RANK
13.4%
SINGLE MALE POVERTY
2.1/ 100
METRIC RATING
242nd/ 347
METRIC RANK
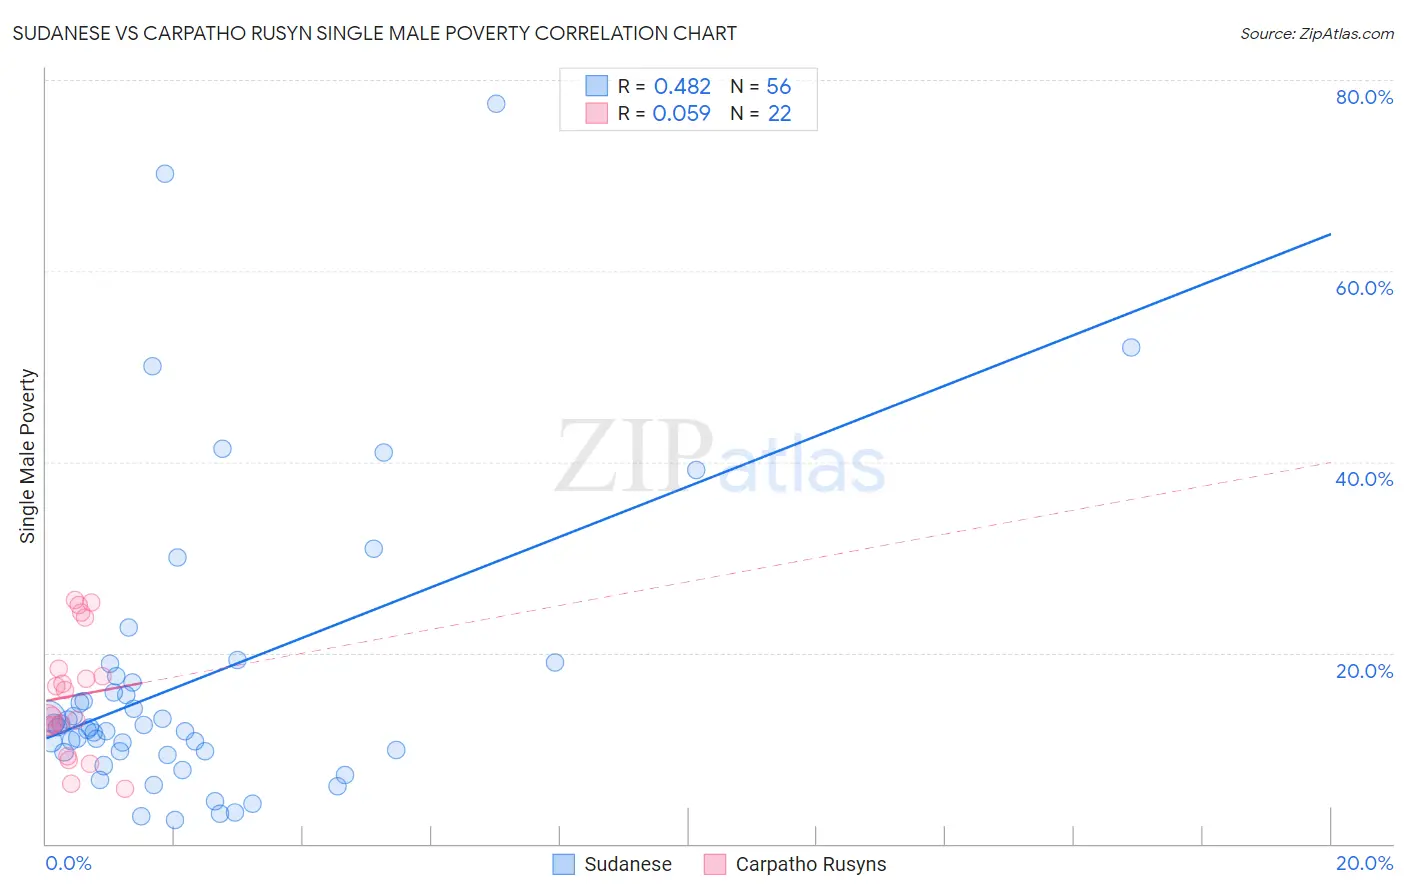
Sudanese vs Carpatho Rusyn Single Male Poverty Correlation Chart
The statistical analysis conducted on geographies consisting of 106,028,362 people shows a moderate positive correlation between the proportion of Sudanese and poverty level among single males in the United States with a correlation coefficient (R) of 0.482 and weighted average of 13.1%. Similarly, the statistical analysis conducted on geographies consisting of 56,393,502 people shows a slight positive correlation between the proportion of Carpatho Rusyns and poverty level among single males in the United States with a correlation coefficient (R) of 0.059 and weighted average of 13.4%, a difference of 3.0%.
Single Male Poverty Correlation Summary
| Measurement | Sudanese | Carpatho Rusyn |
| Minimum | 2.5% | 5.7% |
| Maximum | 77.6% | 25.6% |
| Range | 75.0% | 19.9% |
| Mean | 17.1% | 15.5% |
| Median | 12.2% | 14.7% |
| Interquartile 25% (IQ1) | 9.6% | 12.3% |
| Interquartile 75% (IQ3) | 17.2% | 18.3% |
| Interquartile Range (IQR) | 7.5% | 6.0% |
| Standard Deviation (Sample) | 15.6% | 6.2% |
| Standard Deviation (Population) | 15.5% | 6.1% |
Similar Demographics by Single Male Poverty
Demographics Similar to Sudanese by Single Male Poverty
In terms of single male poverty, the demographic groups most similar to Sudanese are Immigrants from Western Africa (13.1%, a difference of 0.010%), Mexican American Indian (13.1%, a difference of 0.020%), Immigrants from Haiti (13.1%, a difference of 0.080%), Swedish (13.1%, a difference of 0.080%), and Northern European (13.0%, a difference of 0.10%).
| Demographics | Rating | Rank | Single Male Poverty |
| Slovenes | 21.6 /100 | #200 | Fair 13.0% |
| Trinidadians and Tobagonians | 21.4 /100 | #201 | Fair 13.0% |
| Basques | 20.7 /100 | #202 | Fair 13.0% |
| Immigrants | Bangladesh | 20.4 /100 | #203 | Fair 13.0% |
| Estonians | 20.3 /100 | #204 | Fair 13.0% |
| Poles | 19.3 /100 | #205 | Poor 13.0% |
| Northern Europeans | 18.9 /100 | #206 | Poor 13.0% |
| Sudanese | 17.7 /100 | #207 | Poor 13.1% |
| Immigrants | Western Africa | 17.6 /100 | #208 | Poor 13.1% |
| Mexican American Indians | 17.5 /100 | #209 | Poor 13.1% |
| Immigrants | Haiti | 16.8 /100 | #210 | Poor 13.1% |
| Swedes | 16.8 /100 | #211 | Poor 13.1% |
| Senegalese | 16.4 /100 | #212 | Poor 13.1% |
| Italians | 15.9 /100 | #213 | Poor 13.1% |
| Zimbabweans | 14.9 /100 | #214 | Poor 13.1% |
Demographics Similar to Carpatho Rusyns by Single Male Poverty
In terms of single male poverty, the demographic groups most similar to Carpatho Rusyns are Immigrants from Germany (13.4%, a difference of 0.010%), Barbadian (13.4%, a difference of 0.050%), Belizean (13.4%, a difference of 0.12%), Immigrants from Senegal (13.5%, a difference of 0.32%), and Czechoslovakian (13.4%, a difference of 0.43%).
| Demographics | Rating | Rank | Single Male Poverty |
| Bangladeshis | 3.7 /100 | #235 | Tragic 13.3% |
| Luxembourgers | 3.6 /100 | #236 | Tragic 13.4% |
| British West Indians | 3.4 /100 | #237 | Tragic 13.4% |
| Immigrants | Ghana | 3.2 /100 | #238 | Tragic 13.4% |
| Czechoslovakians | 3.0 /100 | #239 | Tragic 13.4% |
| Belizeans | 2.3 /100 | #240 | Tragic 13.4% |
| Immigrants | Germany | 2.1 /100 | #241 | Tragic 13.4% |
| Carpatho Rusyns | 2.1 /100 | #242 | Tragic 13.4% |
| Barbadians | 2.1 /100 | #243 | Tragic 13.4% |
| Immigrants | Senegal | 1.7 /100 | #244 | Tragic 13.5% |
| Immigrants | Latin America | 1.3 /100 | #245 | Tragic 13.5% |
| Immigrants | Micronesia | 1.2 /100 | #246 | Tragic 13.5% |
| Belgians | 1.2 /100 | #247 | Tragic 13.5% |
| Czechs | 1.2 /100 | #248 | Tragic 13.5% |
| Spanish | 1.0 /100 | #249 | Tragic 13.6% |