Colville vs Salvadoran Single Male Poverty
COMPARE
Colville
Salvadoran
Single Male Poverty
Single Male Poverty Comparison
Colville
Salvadorans
18.4%
SINGLE MALE POVERTY
0.0/ 100
METRIC RATING
329th/ 347
METRIC RANK
12.5%
SINGLE MALE POVERTY
83.7/ 100
METRIC RATING
132nd/ 347
METRIC RANK
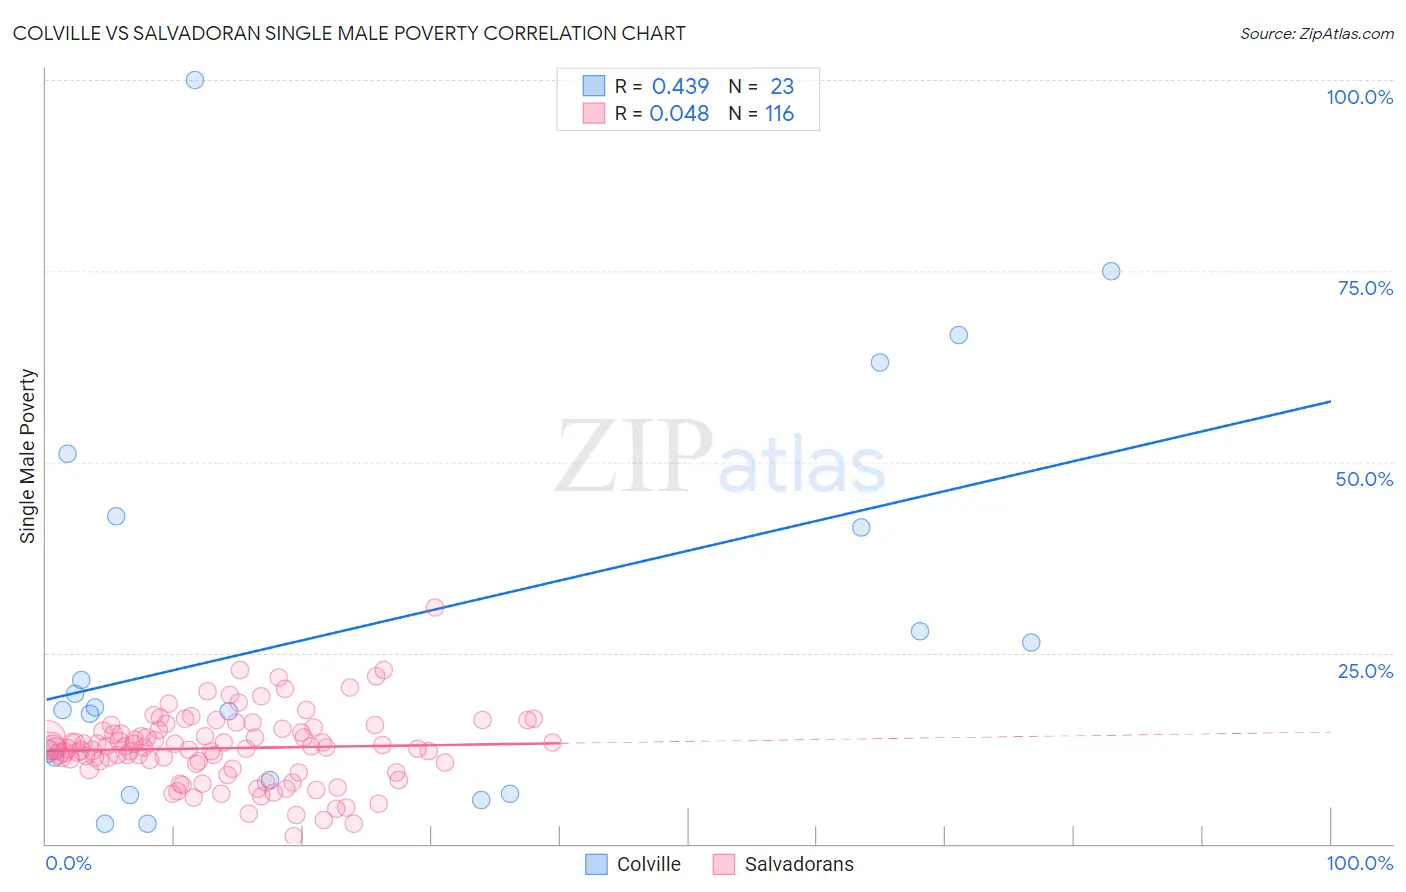
Colville vs Salvadoran Single Male Poverty Correlation Chart
The statistical analysis conducted on geographies consisting of 33,707,380 people shows a moderate positive correlation between the proportion of Colville and poverty level among single males in the United States with a correlation coefficient (R) of 0.439 and weighted average of 18.4%. Similarly, the statistical analysis conducted on geographies consisting of 358,837,331 people shows no correlation between the proportion of Salvadorans and poverty level among single males in the United States with a correlation coefficient (R) of 0.048 and weighted average of 12.5%, a difference of 47.2%.
Single Male Poverty Correlation Summary
| Measurement | Colville | Salvadoran |
| Minimum | 2.6% | 1.0% |
| Maximum | 100.0% | 30.9% |
| Range | 97.4% | 29.9% |
| Mean | 28.7% | 12.5% |
| Median | 17.8% | 12.6% |
| Interquartile 25% (IQ1) | 8.3% | 10.2% |
| Interquartile 75% (IQ3) | 42.9% | 14.9% |
| Interquartile Range (IQR) | 34.5% | 4.7% |
| Standard Deviation (Sample) | 26.3% | 4.7% |
| Standard Deviation (Population) | 25.7% | 4.6% |
Similar Demographics by Single Male Poverty
Demographics Similar to Colville by Single Male Poverty
In terms of single male poverty, the demographic groups most similar to Colville are Kiowa (18.3%, a difference of 0.73%), Cajun (19.1%, a difference of 3.5%), Menominee (17.7%, a difference of 4.0%), Paiute (19.3%, a difference of 4.6%), and Native/Alaskan (19.6%, a difference of 6.4%).
| Demographics | Rating | Rank | Single Male Poverty |
| Shoshone | 0.0 /100 | #322 | Tragic 16.7% |
| Creek | 0.0 /100 | #323 | Tragic 16.8% |
| Immigrants | Yemen | 0.0 /100 | #324 | Tragic 16.9% |
| Choctaw | 0.0 /100 | #325 | Tragic 17.0% |
| Central American Indians | 0.0 /100 | #326 | Tragic 17.2% |
| Menominee | 0.0 /100 | #327 | Tragic 17.7% |
| Kiowa | 0.0 /100 | #328 | Tragic 18.3% |
| Colville | 0.0 /100 | #329 | Tragic 18.4% |
| Cajuns | 0.0 /100 | #330 | Tragic 19.1% |
| Paiute | 0.0 /100 | #331 | Tragic 19.3% |
| Natives/Alaskans | 0.0 /100 | #332 | Tragic 19.6% |
| Inupiat | 0.0 /100 | #333 | Tragic 20.0% |
| Pima | 0.0 /100 | #334 | Tragic 20.2% |
| Yuman | 0.0 /100 | #335 | Tragic 21.3% |
| Tohono O'odham | 0.0 /100 | #336 | Tragic 21.6% |
Demographics Similar to Salvadorans by Single Male Poverty
In terms of single male poverty, the demographic groups most similar to Salvadorans are Immigrants from Northern Europe (12.5%, a difference of 0.0%), Immigrants from Western Asia (12.5%, a difference of 0.030%), Immigrants from Nicaragua (12.5%, a difference of 0.12%), Immigrants from Ecuador (12.5%, a difference of 0.15%), and Immigrants from Costa Rica (12.5%, a difference of 0.17%).
| Demographics | Rating | Rank | Single Male Poverty |
| Immigrants | Jordan | 87.1 /100 | #125 | Excellent 12.5% |
| Romanians | 86.4 /100 | #126 | Excellent 12.5% |
| Immigrants | Netherlands | 86.2 /100 | #127 | Excellent 12.5% |
| Ecuadorians | 85.9 /100 | #128 | Excellent 12.5% |
| Immigrants | Sierra Leone | 85.5 /100 | #129 | Excellent 12.5% |
| Immigrants | Nicaragua | 84.8 /100 | #130 | Excellent 12.5% |
| Immigrants | Northern Europe | 83.7 /100 | #131 | Excellent 12.5% |
| Salvadorans | 83.7 /100 | #132 | Excellent 12.5% |
| Immigrants | Western Asia | 83.4 /100 | #133 | Excellent 12.5% |
| Immigrants | Ecuador | 82.1 /100 | #134 | Excellent 12.5% |
| Immigrants | Costa Rica | 81.9 /100 | #135 | Excellent 12.5% |
| Immigrants | Austria | 81.9 /100 | #136 | Excellent 12.5% |
| Ukrainians | 80.7 /100 | #137 | Excellent 12.6% |
| Immigrants | El Salvador | 80.0 /100 | #138 | Excellent 12.6% |
| Cubans | 79.9 /100 | #139 | Good 12.6% |