Jamaican vs Immigrants from Moldova Single Female Poverty
COMPARE
Jamaican
Immigrants from Moldova
Single Female Poverty
Single Female Poverty Comparison
Jamaicans
Immigrants from Moldova
21.6%
SINGLE FEMALE POVERTY
14.0/ 100
METRIC RATING
212th/ 347
METRIC RANK
18.5%
SINGLE FEMALE POVERTY
100.0/ 100
METRIC RATING
28th/ 347
METRIC RANK
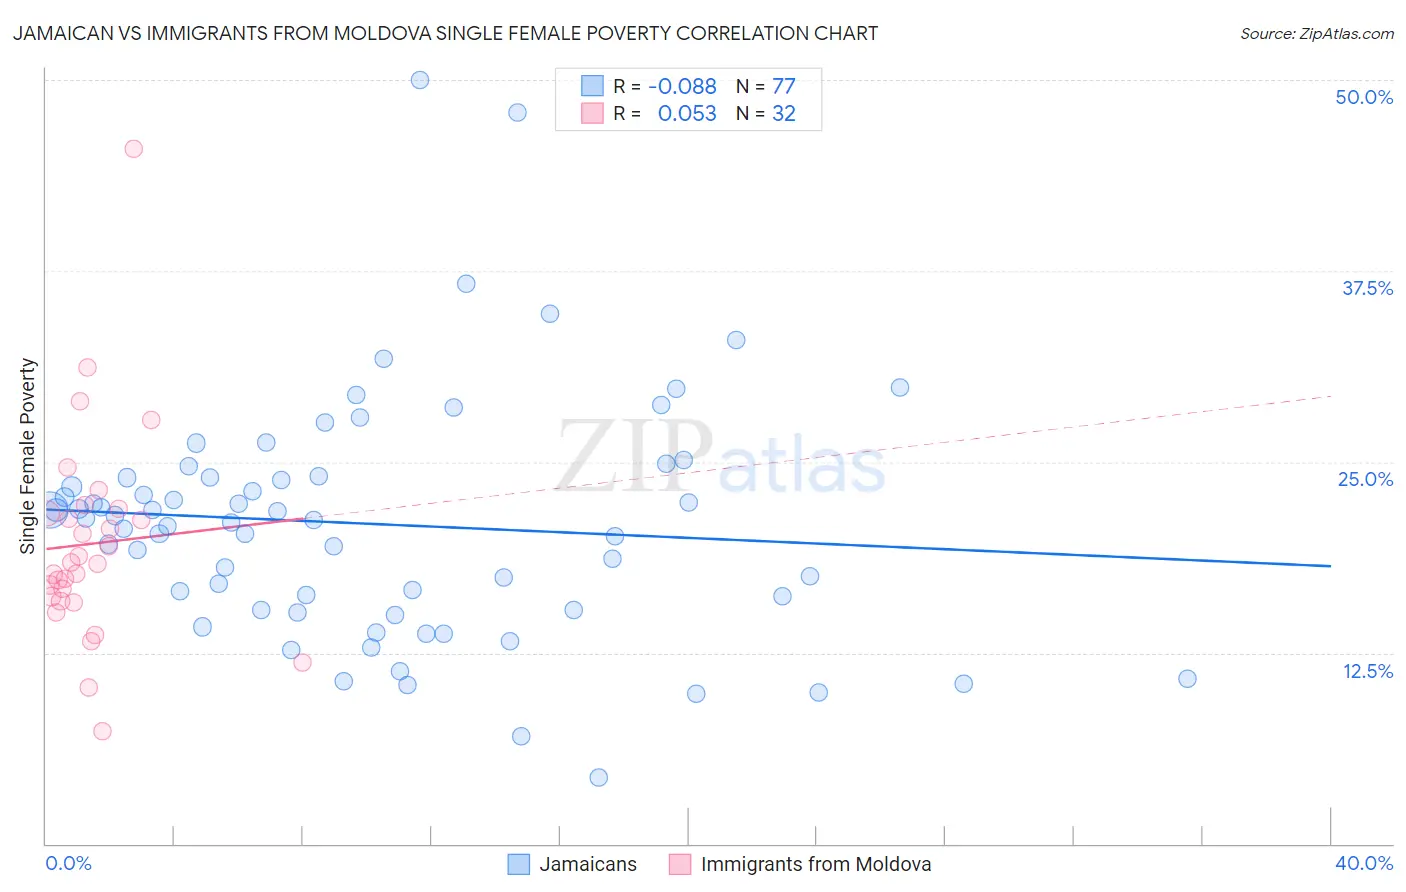
Jamaican vs Immigrants from Moldova Single Female Poverty Correlation Chart
The statistical analysis conducted on geographies consisting of 363,369,042 people shows a slight negative correlation between the proportion of Jamaicans and poverty level among single females in the United States with a correlation coefficient (R) of -0.088 and weighted average of 21.6%. Similarly, the statistical analysis conducted on geographies consisting of 123,598,382 people shows a slight positive correlation between the proportion of Immigrants from Moldova and poverty level among single females in the United States with a correlation coefficient (R) of 0.053 and weighted average of 18.5%, a difference of 16.8%.
Single Female Poverty Correlation Summary
| Measurement | Jamaican | Immigrants from Moldova |
| Minimum | 4.4% | 7.4% |
| Maximum | 50.0% | 45.5% |
| Range | 45.6% | 38.2% |
| Mean | 20.9% | 19.6% |
| Median | 21.2% | 18.4% |
| Interquartile 25% (IQ1) | 15.3% | 16.0% |
| Interquartile 75% (IQ3) | 24.0% | 21.8% |
| Interquartile Range (IQR) | 8.7% | 5.7% |
| Standard Deviation (Sample) | 7.9% | 6.9% |
| Standard Deviation (Population) | 7.9% | 6.8% |
Similar Demographics by Single Female Poverty
Demographics Similar to Jamaicans by Single Female Poverty
In terms of single female poverty, the demographic groups most similar to Jamaicans are Icelander (21.6%, a difference of 0.010%), Guamanian/Chamorro (21.6%, a difference of 0.030%), Immigrants from Panama (21.6%, a difference of 0.050%), Immigrants from Nicaragua (21.6%, a difference of 0.090%), and Immigrants from Eastern Africa (21.6%, a difference of 0.14%).
| Demographics | Rating | Rank | Single Female Poverty |
| Finns | 16.2 /100 | #205 | Poor 21.5% |
| Belgians | 16.1 /100 | #206 | Poor 21.5% |
| Ghanaians | 15.7 /100 | #207 | Poor 21.6% |
| Haitians | 15.4 /100 | #208 | Poor 21.6% |
| Immigrants | Eastern Africa | 15.1 /100 | #209 | Poor 21.6% |
| Immigrants | Panama | 14.4 /100 | #210 | Poor 21.6% |
| Icelanders | 14.0 /100 | #211 | Poor 21.6% |
| Jamaicans | 14.0 /100 | #212 | Poor 21.6% |
| Guamanians/Chamorros | 13.7 /100 | #213 | Poor 21.6% |
| Immigrants | Nicaragua | 13.3 /100 | #214 | Poor 21.6% |
| Ecuadorians | 12.3 /100 | #215 | Poor 21.6% |
| Immigrants | Barbados | 12.2 /100 | #216 | Poor 21.7% |
| Immigrants | St. Vincent and the Grenadines | 11.7 /100 | #217 | Poor 21.7% |
| Nepalese | 9.7 /100 | #218 | Tragic 21.7% |
| Panamanians | 9.4 /100 | #219 | Tragic 21.7% |
Demographics Similar to Immigrants from Moldova by Single Female Poverty
In terms of single female poverty, the demographic groups most similar to Immigrants from Moldova are Immigrants from Poland (18.5%, a difference of 0.10%), Immigrants from North Macedonia (18.5%, a difference of 0.26%), Immigrants from Asia (18.6%, a difference of 0.31%), Immigrants from Sri Lanka (18.6%, a difference of 0.39%), and Immigrants from Philippines (18.6%, a difference of 0.46%).
| Demographics | Rating | Rank | Single Female Poverty |
| Maltese | 100.0 /100 | #21 | Exceptional 18.3% |
| Burmese | 100.0 /100 | #22 | Exceptional 18.3% |
| Asians | 100.0 /100 | #23 | Exceptional 18.3% |
| Armenians | 100.0 /100 | #24 | Exceptional 18.3% |
| Immigrants | Singapore | 100.0 /100 | #25 | Exceptional 18.3% |
| Immigrants | Israel | 100.0 /100 | #26 | Exceptional 18.3% |
| Immigrants | Pakistan | 100.0 /100 | #27 | Exceptional 18.4% |
| Immigrants | Moldova | 100.0 /100 | #28 | Exceptional 18.5% |
| Immigrants | Poland | 100.0 /100 | #29 | Exceptional 18.5% |
| Immigrants | North Macedonia | 99.9 /100 | #30 | Exceptional 18.5% |
| Immigrants | Asia | 99.9 /100 | #31 | Exceptional 18.6% |
| Immigrants | Sri Lanka | 99.9 /100 | #32 | Exceptional 18.6% |
| Immigrants | Philippines | 99.9 /100 | #33 | Exceptional 18.6% |
| Koreans | 99.9 /100 | #34 | Exceptional 18.6% |
| Immigrants | Japan | 99.9 /100 | #35 | Exceptional 18.6% |