Chippewa vs German Russian College, 1 year or more
COMPARE
Chippewa
German Russian
College, 1 year or more
College, 1 year or more Comparison
Chippewa
German Russians
55.7%
COLLEGE, 1 YEAR OR MORE
0.9/ 100
METRIC RATING
244th/ 347
METRIC RANK
59.1%
COLLEGE, 1 YEAR OR MORE
39.3/ 100
METRIC RATING
183rd/ 347
METRIC RANK
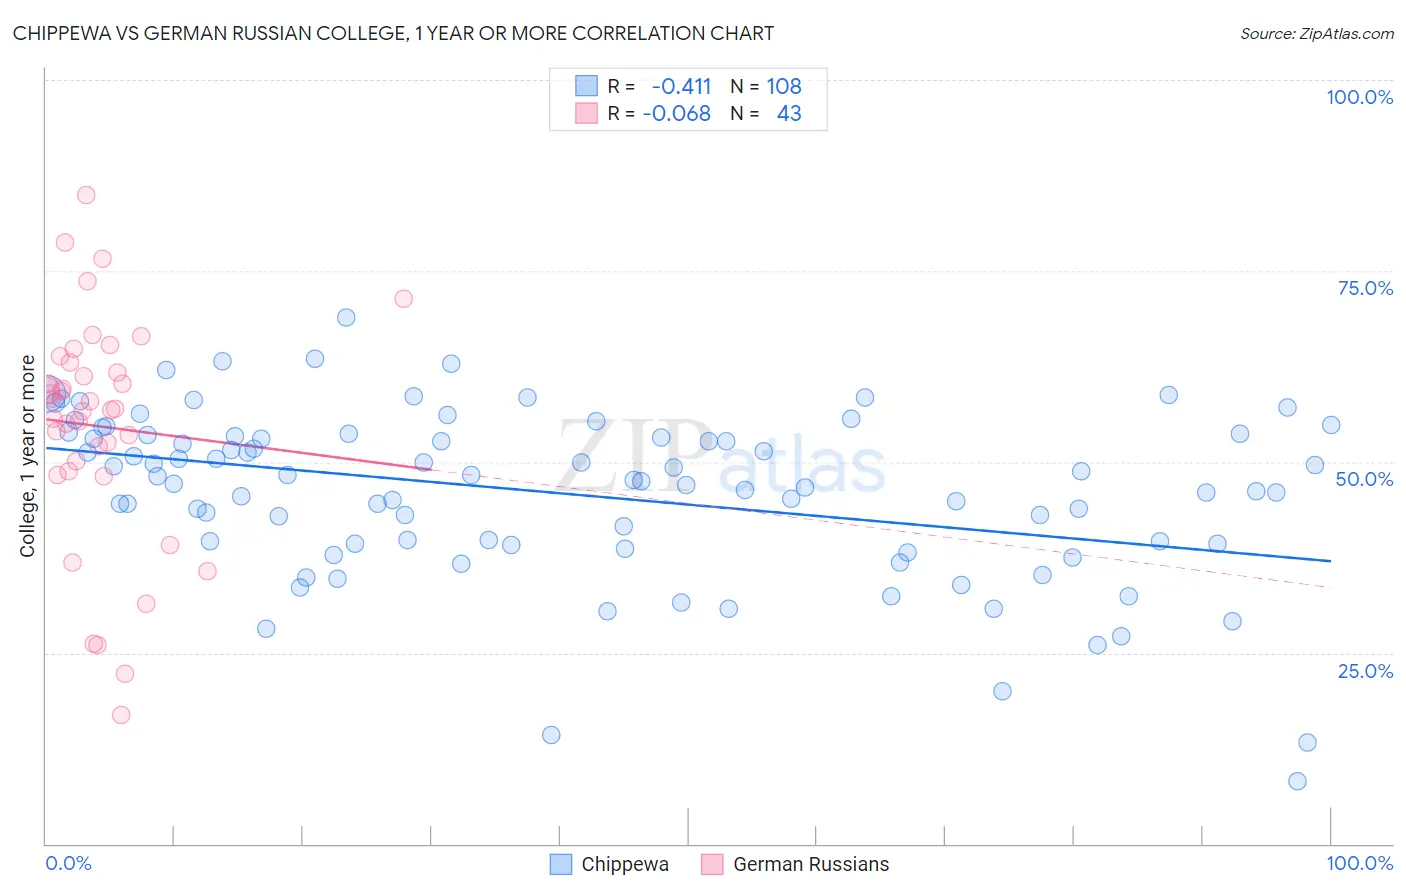
Chippewa vs German Russian College, 1 year or more Correlation Chart
The statistical analysis conducted on geographies consisting of 215,068,137 people shows a moderate negative correlation between the proportion of Chippewa and percentage of population with at least college, 1 year or more education in the United States with a correlation coefficient (R) of -0.411 and weighted average of 55.7%. Similarly, the statistical analysis conducted on geographies consisting of 96,461,984 people shows a slight negative correlation between the proportion of German Russians and percentage of population with at least college, 1 year or more education in the United States with a correlation coefficient (R) of -0.068 and weighted average of 59.1%, a difference of 6.1%.
College, 1 year or more Correlation Summary
| Measurement | Chippewa | German Russian |
| Minimum | 8.2% | 16.9% |
| Maximum | 68.9% | 84.9% |
| Range | 60.6% | 68.0% |
| Mean | 45.8% | 54.7% |
| Median | 47.6% | 57.0% |
| Interquartile 25% (IQ1) | 39.3% | 48.8% |
| Interquartile 75% (IQ3) | 53.4% | 63.0% |
| Interquartile Range (IQR) | 14.2% | 14.2% |
| Standard Deviation (Sample) | 11.1% | 14.9% |
| Standard Deviation (Population) | 11.0% | 14.7% |
Similar Demographics by College, 1 year or more
Demographics Similar to Chippewa by College, 1 year or more
In terms of college, 1 year or more, the demographic groups most similar to Chippewa are Immigrants from Liberia (55.7%, a difference of 0.070%), Malaysian (55.6%, a difference of 0.11%), Osage (55.8%, a difference of 0.12%), Marshallese (55.8%, a difference of 0.13%), and Hawaiian (55.6%, a difference of 0.19%).
| Demographics | Rating | Rank | College, 1 year or more |
| Samoans | 1.6 /100 | #237 | Tragic 56.2% |
| Barbadians | 1.3 /100 | #238 | Tragic 56.0% |
| Puget Sound Salish | 1.1 /100 | #239 | Tragic 55.9% |
| Trinidadians and Tobagonians | 1.1 /100 | #240 | Tragic 55.8% |
| French American Indians | 1.0 /100 | #241 | Tragic 55.8% |
| Marshallese | 1.0 /100 | #242 | Tragic 55.8% |
| Osage | 1.0 /100 | #243 | Tragic 55.8% |
| Chippewa | 0.9 /100 | #244 | Tragic 55.7% |
| Immigrants | Liberia | 0.8 /100 | #245 | Tragic 55.7% |
| Malaysians | 0.8 /100 | #246 | Tragic 55.6% |
| Hawaiians | 0.8 /100 | #247 | Tragic 55.6% |
| Immigrants | Congo | 0.8 /100 | #248 | Tragic 55.6% |
| Immigrants | Trinidad and Tobago | 0.7 /100 | #249 | Tragic 55.5% |
| Delaware | 0.7 /100 | #250 | Tragic 55.5% |
| Immigrants | Cambodia | 0.6 /100 | #251 | Tragic 55.4% |
Demographics Similar to German Russians by College, 1 year or more
In terms of college, 1 year or more, the demographic groups most similar to German Russians are Spaniard (59.0%, a difference of 0.060%), Immigrants from Bosnia and Herzegovina (59.2%, a difference of 0.19%), South American (59.0%, a difference of 0.20%), Swiss (59.2%, a difference of 0.22%), and Yugoslavian (59.2%, a difference of 0.26%).
| Demographics | Rating | Rank | College, 1 year or more |
| Immigrants | Poland | 48.9 /100 | #176 | Average 59.4% |
| Tlingit-Haida | 48.4 /100 | #177 | Average 59.4% |
| Czechoslovakians | 48.3 /100 | #178 | Average 59.4% |
| Bermudans | 46.6 /100 | #179 | Average 59.3% |
| Yugoslavians | 44.1 /100 | #180 | Average 59.2% |
| Swiss | 43.4 /100 | #181 | Average 59.2% |
| Immigrants | Bosnia and Herzegovina | 42.8 /100 | #182 | Average 59.2% |
| German Russians | 39.3 /100 | #183 | Fair 59.1% |
| Spaniards | 38.3 /100 | #184 | Fair 59.0% |
| South Americans | 35.9 /100 | #185 | Fair 59.0% |
| Scotch-Irish | 34.7 /100 | #186 | Fair 58.9% |
| Germans | 34.7 /100 | #187 | Fair 58.9% |
| French | 34.4 /100 | #188 | Fair 58.9% |
| Uruguayans | 31.8 /100 | #189 | Fair 58.8% |
| Immigrants | Cameroon | 31.2 /100 | #190 | Fair 58.8% |