Swiss vs German Russian Single Female Poverty
COMPARE
Swiss
German Russian
Single Female Poverty
Single Female Poverty Comparison
Swiss
German Russians
21.4%
SINGLE FEMALE POVERTY
24.2/ 100
METRIC RATING
198th/ 347
METRIC RANK
23.9%
SINGLE FEMALE POVERTY
0.0/ 100
METRIC RATING
283rd/ 347
METRIC RANK
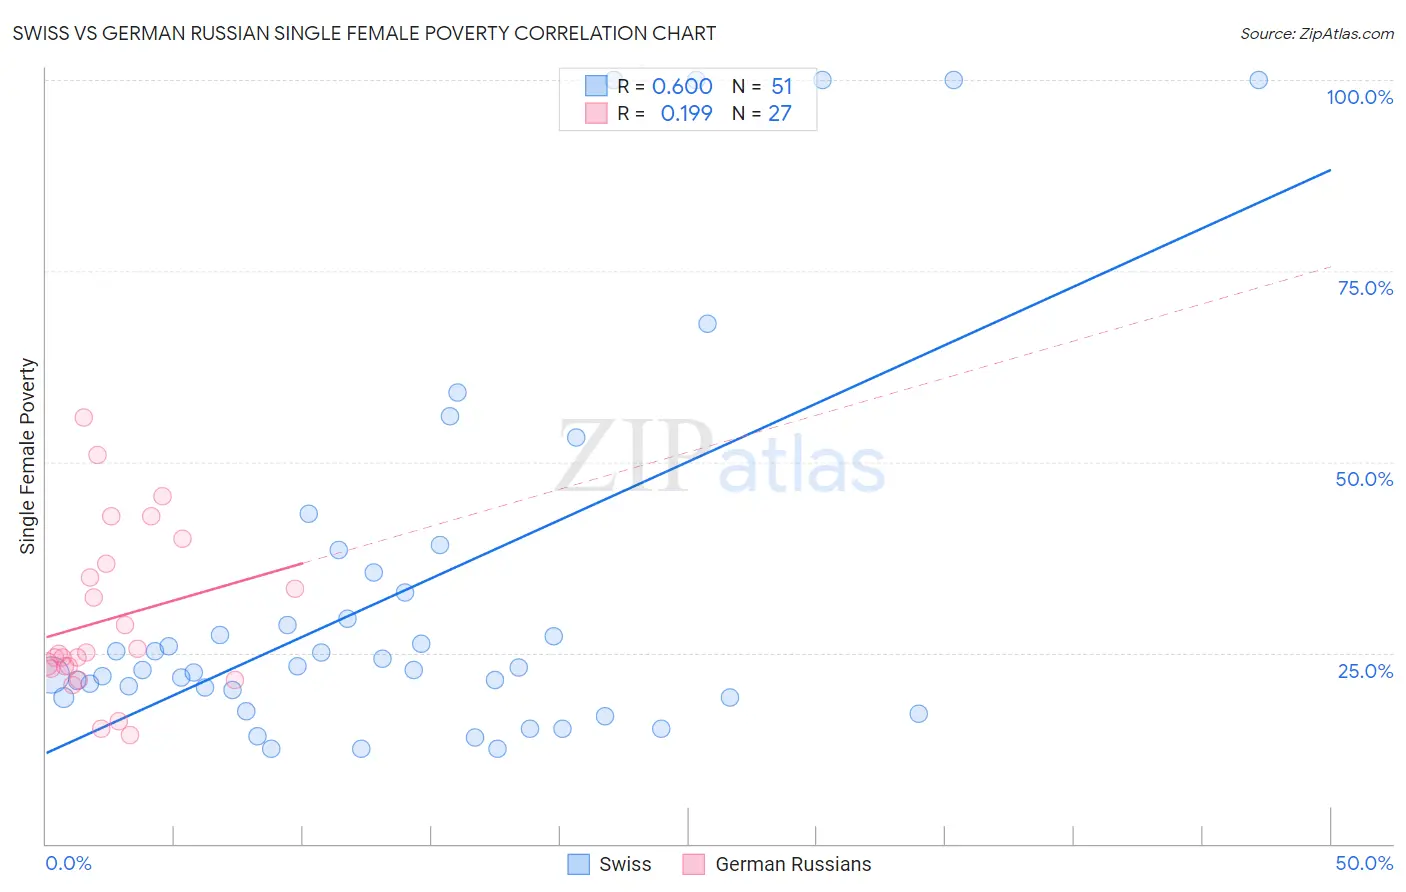
Swiss vs German Russian Single Female Poverty Correlation Chart
The statistical analysis conducted on geographies consisting of 453,637,180 people shows a substantial positive correlation between the proportion of Swiss and poverty level among single females in the United States with a correlation coefficient (R) of 0.600 and weighted average of 21.4%. Similarly, the statistical analysis conducted on geographies consisting of 96,093,035 people shows a poor positive correlation between the proportion of German Russians and poverty level among single females in the United States with a correlation coefficient (R) of 0.199 and weighted average of 23.9%, a difference of 11.7%.
Single Female Poverty Correlation Summary
| Measurement | Swiss | German Russian |
| Minimum | 12.5% | 14.3% |
| Maximum | 100.0% | 55.7% |
| Range | 87.5% | 41.4% |
| Mean | 33.2% | 29.4% |
| Median | 23.1% | 25.0% |
| Interquartile 25% (IQ1) | 19.2% | 22.9% |
| Interquartile 75% (IQ3) | 35.5% | 36.6% |
| Interquartile Range (IQR) | 16.3% | 13.7% |
| Standard Deviation (Sample) | 25.2% | 10.9% |
| Standard Deviation (Population) | 25.0% | 10.7% |
Similar Demographics by Single Female Poverty
Demographics Similar to Swiss by Single Female Poverty
In terms of single female poverty, the demographic groups most similar to Swiss are Japanese (21.3%, a difference of 0.17%), Immigrants (21.4%, a difference of 0.19%), Immigrants from Saudi Arabia (21.3%, a difference of 0.23%), Irish (21.4%, a difference of 0.25%), and Nicaraguan (21.3%, a difference of 0.27%).
| Demographics | Rating | Rank | Single Female Poverty |
| Immigrants | Germany | 31.1 /100 | #191 | Fair 21.3% |
| Immigrants | Jamaica | 30.5 /100 | #192 | Fair 21.3% |
| Basques | 28.1 /100 | #193 | Fair 21.3% |
| Czechoslovakians | 27.7 /100 | #194 | Fair 21.3% |
| Nicaraguans | 27.6 /100 | #195 | Fair 21.3% |
| Immigrants | Saudi Arabia | 27.1 /100 | #196 | Fair 21.3% |
| Japanese | 26.4 /100 | #197 | Fair 21.3% |
| Swiss | 24.2 /100 | #198 | Fair 21.4% |
| Immigrants | Immigrants | 22.0 /100 | #199 | Fair 21.4% |
| Irish | 21.4 /100 | #200 | Fair 21.4% |
| Nigerians | 20.9 /100 | #201 | Fair 21.4% |
| Immigrants | Kenya | 20.7 /100 | #202 | Fair 21.4% |
| Immigrants | Haiti | 18.8 /100 | #203 | Poor 21.5% |
| Immigrants | Africa | 16.7 /100 | #204 | Poor 21.5% |
| Finns | 16.2 /100 | #205 | Poor 21.5% |
Demographics Similar to German Russians by Single Female Poverty
In terms of single female poverty, the demographic groups most similar to German Russians are Immigrants from Dominica (23.9%, a difference of 0.11%), Guatemalan (23.8%, a difference of 0.14%), Immigrants from Zaire (23.8%, a difference of 0.20%), Immigrants from Latin America (23.7%, a difference of 0.71%), and Immigrants from Guatemala (24.1%, a difference of 0.97%).
| Demographics | Rating | Rank | Single Female Poverty |
| Immigrants | Azores | 0.0 /100 | #276 | Tragic 23.5% |
| Pennsylvania Germans | 0.0 /100 | #277 | Tragic 23.6% |
| Immigrants | Nonimmigrants | 0.0 /100 | #278 | Tragic 23.6% |
| Alaskan Athabascans | 0.0 /100 | #279 | Tragic 23.6% |
| Immigrants | Latin America | 0.0 /100 | #280 | Tragic 23.7% |
| Immigrants | Zaire | 0.0 /100 | #281 | Tragic 23.8% |
| Guatemalans | 0.0 /100 | #282 | Tragic 23.8% |
| German Russians | 0.0 /100 | #283 | Tragic 23.9% |
| Immigrants | Dominica | 0.0 /100 | #284 | Tragic 23.9% |
| Immigrants | Guatemala | 0.0 /100 | #285 | Tragic 24.1% |
| Cree | 0.0 /100 | #286 | Tragic 24.1% |
| Bangladeshis | 0.0 /100 | #287 | Tragic 24.2% |
| Spanish Americans | 0.0 /100 | #288 | Tragic 24.2% |
| U.S. Virgin Islanders | 0.0 /100 | #289 | Tragic 24.2% |
| Indonesians | 0.0 /100 | #290 | Tragic 24.3% |