Chinese vs Sioux Family Poverty
COMPARE
Chinese
Sioux
Family Poverty
Family Poverty Comparison
Chinese
Sioux
6.5%
FAMILY POVERTY
100.0/ 100
METRIC RATING
2nd/ 347
METRIC RANK
15.9%
FAMILY POVERTY
0.0/ 100
METRIC RATING
336th/ 347
METRIC RANK
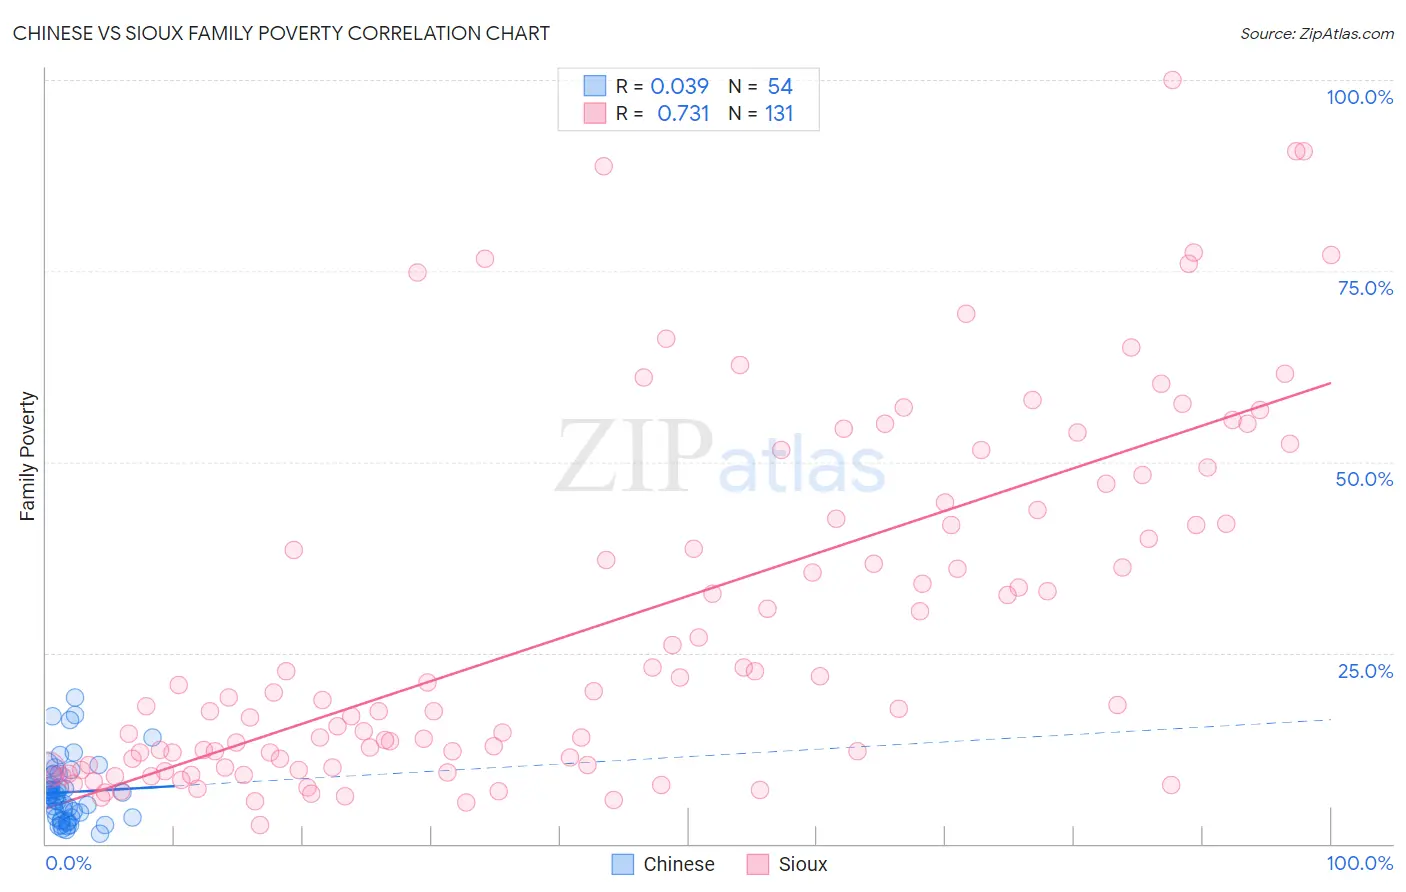
Chinese vs Sioux Family Poverty Correlation Chart
The statistical analysis conducted on geographies consisting of 64,784,795 people shows no correlation between the proportion of Chinese and poverty level among families in the United States with a correlation coefficient (R) of 0.039 and weighted average of 6.5%. Similarly, the statistical analysis conducted on geographies consisting of 233,799,830 people shows a strong positive correlation between the proportion of Sioux and poverty level among families in the United States with a correlation coefficient (R) of 0.731 and weighted average of 15.9%, a difference of 143.7%.
Family Poverty Correlation Summary
| Measurement | Chinese | Sioux |
| Minimum | 1.3% | 2.5% |
| Maximum | 19.1% | 100.0% |
| Range | 17.8% | 97.5% |
| Mean | 6.8% | 29.0% |
| Median | 6.3% | 18.8% |
| Interquartile 25% (IQ1) | 3.5% | 10.3% |
| Interquartile 75% (IQ3) | 9.0% | 43.6% |
| Interquartile Range (IQR) | 5.5% | 33.4% |
| Standard Deviation (Sample) | 4.1% | 23.2% |
| Standard Deviation (Population) | 4.1% | 23.1% |
Similar Demographics by Family Poverty
Demographics Similar to Chinese by Family Poverty
In terms of family poverty, the demographic groups most similar to Chinese are Immigrants from Taiwan (6.6%, a difference of 1.6%), Filipino (6.6%, a difference of 2.2%), Thai (6.7%, a difference of 2.8%), Immigrants from India (6.2%, a difference of 4.3%), and Norwegian (6.9%, a difference of 5.9%).
| Demographics | Rating | Rank | Family Poverty |
| Immigrants | India | 100.0 /100 | #1 | Exceptional 6.2% |
| Chinese | 100.0 /100 | #2 | Exceptional 6.5% |
| Immigrants | Taiwan | 100.0 /100 | #3 | Exceptional 6.6% |
| Filipinos | 100.0 /100 | #4 | Exceptional 6.6% |
| Thais | 100.0 /100 | #5 | Exceptional 6.7% |
| Norwegians | 99.9 /100 | #6 | Exceptional 6.9% |
| Immigrants | Ireland | 99.9 /100 | #7 | Exceptional 7.0% |
| Bhutanese | 99.9 /100 | #8 | Exceptional 7.0% |
| Latvians | 99.9 /100 | #9 | Exceptional 7.1% |
| Bulgarians | 99.8 /100 | #10 | Exceptional 7.1% |
| Immigrants | Singapore | 99.8 /100 | #11 | Exceptional 7.1% |
| Maltese | 99.8 /100 | #12 | Exceptional 7.1% |
| Swedes | 99.8 /100 | #13 | Exceptional 7.1% |
| Iranians | 99.8 /100 | #14 | Exceptional 7.1% |
| Lithuanians | 99.8 /100 | #15 | Exceptional 7.2% |
Demographics Similar to Sioux by Family Poverty
In terms of family poverty, the demographic groups most similar to Sioux are Hopi (15.9%, a difference of 0.47%), Crow (16.1%, a difference of 1.6%), Yuman (16.6%, a difference of 5.0%), Pueblo (17.0%, a difference of 7.1%), and Lumbee (17.0%, a difference of 7.2%).
| Demographics | Rating | Rank | Family Poverty |
| Blacks/African Americans | 0.0 /100 | #329 | Tragic 13.3% |
| Natives/Alaskans | 0.0 /100 | #330 | Tragic 14.3% |
| Cheyenne | 0.0 /100 | #331 | Tragic 14.3% |
| Dominicans | 0.0 /100 | #332 | Tragic 14.3% |
| Immigrants | Dominican Republic | 0.0 /100 | #333 | Tragic 14.4% |
| Houma | 0.0 /100 | #334 | Tragic 14.6% |
| Apache | 0.0 /100 | #335 | Tragic 14.7% |
| Sioux | 0.0 /100 | #336 | Tragic 15.9% |
| Hopi | 0.0 /100 | #337 | Tragic 15.9% |
| Crow | 0.0 /100 | #338 | Tragic 16.1% |
| Yuman | 0.0 /100 | #339 | Tragic 16.6% |
| Pueblo | 0.0 /100 | #340 | Tragic 17.0% |
| Lumbee | 0.0 /100 | #341 | Tragic 17.0% |
| Immigrants | Yemen | 0.0 /100 | #342 | Tragic 17.5% |
| Pima | 0.0 /100 | #343 | Tragic 18.4% |