Chinese vs Immigrants from Vietnam 3rd Grade
COMPARE
Chinese
Immigrants from Vietnam
3rd Grade
3rd Grade Comparison
Chinese
Immigrants from Vietnam
98.4%
3RD GRADE
100.0/ 100
METRIC RATING
33rd/ 347
METRIC RANK
96.4%
3RD GRADE
0.0/ 100
METRIC RATING
326th/ 347
METRIC RANK
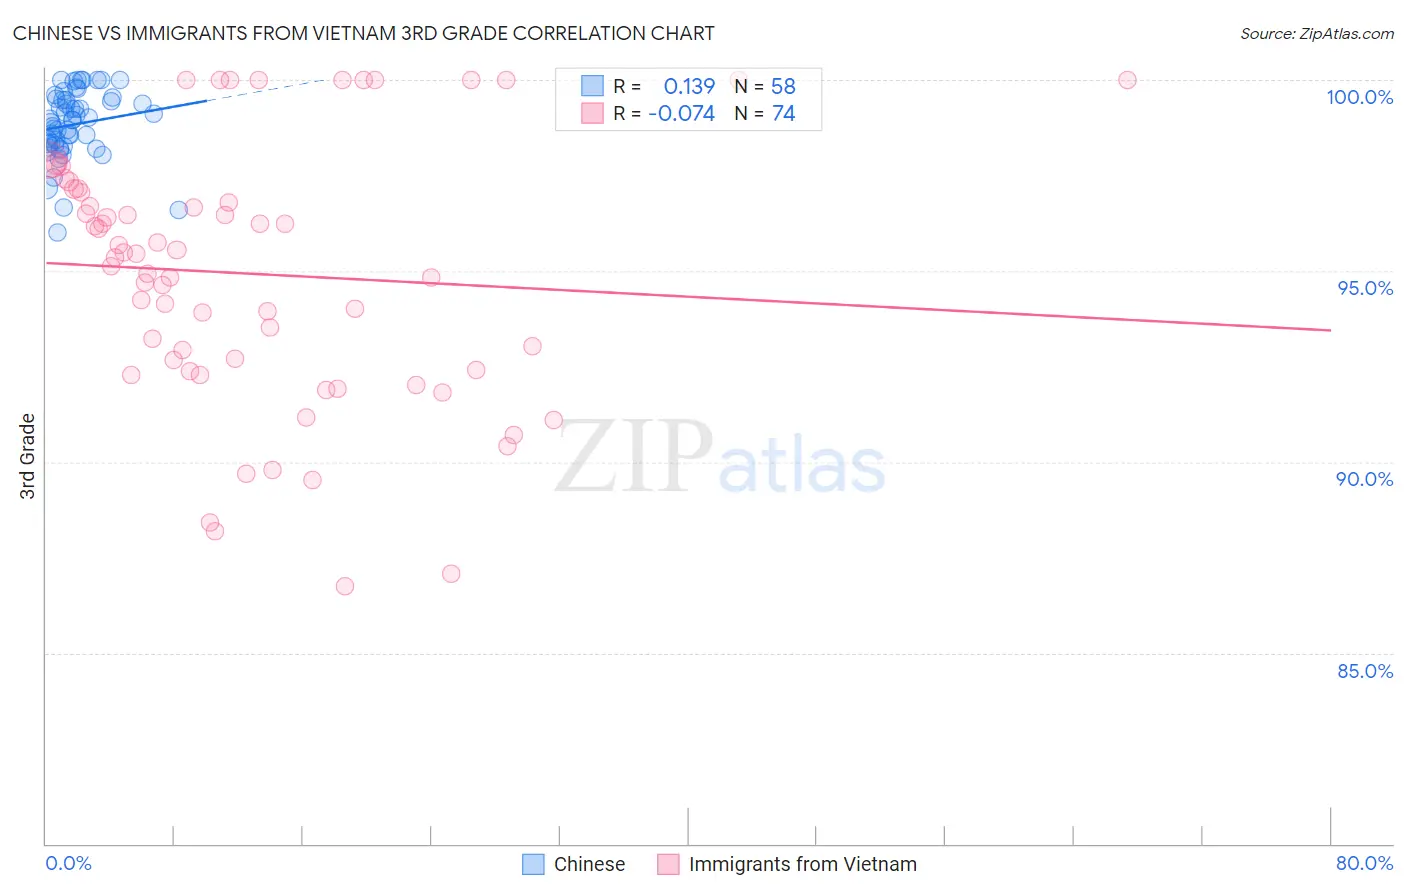
Chinese vs Immigrants from Vietnam 3rd Grade Correlation Chart
The statistical analysis conducted on geographies consisting of 64,808,307 people shows a poor positive correlation between the proportion of Chinese and percentage of population with at least 3rd grade education in the United States with a correlation coefficient (R) of 0.139 and weighted average of 98.4%. Similarly, the statistical analysis conducted on geographies consisting of 404,844,130 people shows a slight negative correlation between the proportion of Immigrants from Vietnam and percentage of population with at least 3rd grade education in the United States with a correlation coefficient (R) of -0.074 and weighted average of 96.4%, a difference of 2.1%.
3rd Grade Correlation Summary
| Measurement | Chinese | Immigrants from Vietnam |
| Minimum | 96.0% | 86.7% |
| Maximum | 100.0% | 100.0% |
| Range | 4.0% | 13.3% |
| Mean | 98.8% | 94.9% |
| Median | 98.9% | 95.4% |
| Interquartile 25% (IQ1) | 98.3% | 92.4% |
| Interquartile 75% (IQ3) | 99.5% | 97.1% |
| Interquartile Range (IQR) | 1.2% | 4.7% |
| Standard Deviation (Sample) | 0.90% | 3.4% |
| Standard Deviation (Population) | 0.89% | 3.3% |
Similar Demographics by 3rd Grade
Demographics Similar to Chinese by 3rd Grade
In terms of 3rd grade, the demographic groups most similar to Chinese are Swiss (98.4%, a difference of 0.010%), Scandinavian (98.4%, a difference of 0.020%), Arapaho (98.4%, a difference of 0.020%), British (98.4%, a difference of 0.020%), and French Canadian (98.4%, a difference of 0.030%).
| Demographics | Rating | Rank | 3rd Grade |
| Aleuts | 100.0 /100 | #26 | Exceptional 98.5% |
| Croatians | 100.0 /100 | #27 | Exceptional 98.5% |
| French | 100.0 /100 | #28 | Exceptional 98.4% |
| French Canadians | 100.0 /100 | #29 | Exceptional 98.4% |
| Europeans | 100.0 /100 | #30 | Exceptional 98.4% |
| Czechs | 100.0 /100 | #31 | Exceptional 98.4% |
| Scandinavians | 100.0 /100 | #32 | Exceptional 98.4% |
| Chinese | 100.0 /100 | #33 | Exceptional 98.4% |
| Swiss | 100.0 /100 | #34 | Exceptional 98.4% |
| Arapaho | 100.0 /100 | #35 | Exceptional 98.4% |
| British | 99.9 /100 | #36 | Exceptional 98.4% |
| Italians | 99.9 /100 | #37 | Exceptional 98.4% |
| Chippewa | 99.9 /100 | #38 | Exceptional 98.4% |
| Latvians | 99.9 /100 | #39 | Exceptional 98.4% |
| Eastern Europeans | 99.9 /100 | #40 | Exceptional 98.3% |
Demographics Similar to Immigrants from Vietnam by 3rd Grade
In terms of 3rd grade, the demographic groups most similar to Immigrants from Vietnam are Japanese (96.4%, a difference of 0.010%), Bangladeshi (96.3%, a difference of 0.010%), Mexican American Indian (96.4%, a difference of 0.030%), Immigrants from Honduras (96.3%, a difference of 0.030%), and Dominican (96.4%, a difference of 0.050%).
| Demographics | Rating | Rank | 3rd Grade |
| Vietnamese | 0.0 /100 | #319 | Tragic 96.5% |
| Immigrants | Nicaragua | 0.0 /100 | #320 | Tragic 96.5% |
| Indonesians | 0.0 /100 | #321 | Tragic 96.5% |
| Immigrants | Belize | 0.0 /100 | #322 | Tragic 96.5% |
| Hondurans | 0.0 /100 | #323 | Tragic 96.5% |
| Dominicans | 0.0 /100 | #324 | Tragic 96.4% |
| Mexican American Indians | 0.0 /100 | #325 | Tragic 96.4% |
| Immigrants | Vietnam | 0.0 /100 | #326 | Tragic 96.4% |
| Japanese | 0.0 /100 | #327 | Tragic 96.4% |
| Bangladeshis | 0.0 /100 | #328 | Tragic 96.3% |
| Immigrants | Honduras | 0.0 /100 | #329 | Tragic 96.3% |
| Immigrants | Armenia | 0.0 /100 | #330 | Tragic 96.3% |
| Immigrants | Latin America | 0.0 /100 | #331 | Tragic 96.2% |
| Mexicans | 0.0 /100 | #332 | Tragic 96.2% |
| Immigrants | Fiji | 0.0 /100 | #333 | Tragic 96.2% |